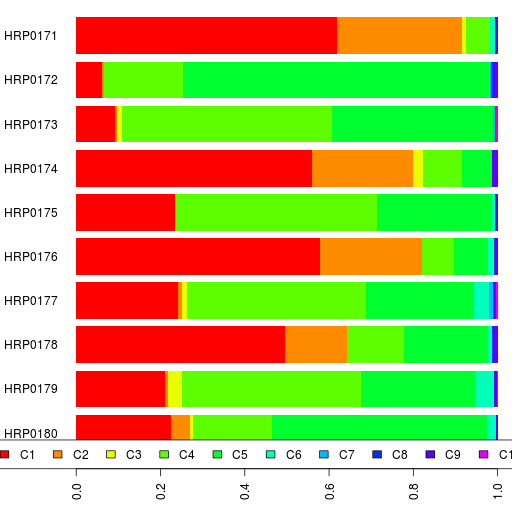
Here are the admixture results using Reference 3 for Harappa participants HRP0171 to HRP0180.
You can see the participant results in a spreadsheet as well as their ethnic breakdowns and the reference population results.
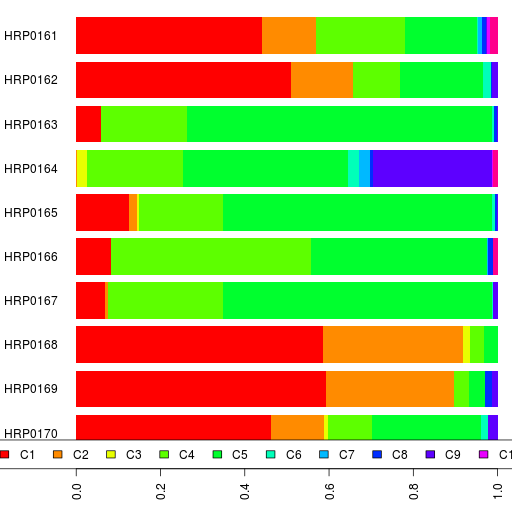
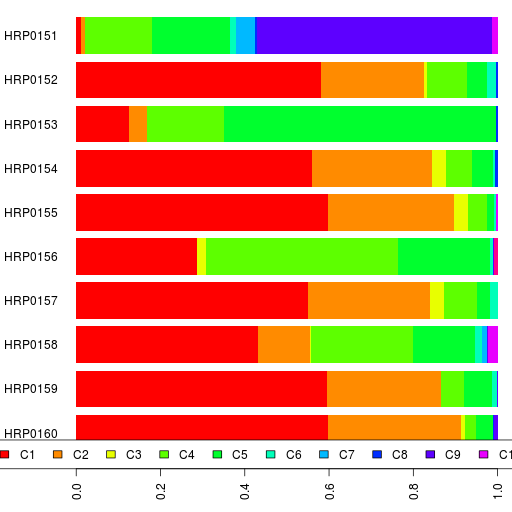
Here's our bar chart and table. Remember you can click on the legend or the table headers to sort.
If the above interactive charts are not working, here's a static bar graph.
HRP0171 is our 2nd Tamil Vellalar from Sri Lanka and the results are similar to HRP0169.
HRP0172 has 1/16 Romani ancestry. The Onge component is about 0.4% which could be noise or possibly evidence of a South Asian connection via the Romany.
HRP0174 and HRP0176 are Kerala Nairs.
HRP0175 is a Georgian Svan and pretty similar to HRP0138 (who is Georgian but not sure which local ethnic group).
HRP0177 (Azeri) is a bit more northern European than HRP0083.
HRP0178, our first Punjabi Khatri, has admixture results more like the Punjabi Jatts than Punjabi Brahmins.
HRP0179, who is 7/8 Turkish and 1/8 Kurd, has the highest Siberian component (5%) other than the Kazakh participant.
HRP0180 is our first Pashtun even if he's only half-Pathan (the other half being English). I have heard grumblings on the net about the HGDP Pathans not being representative of the Pashtun tribes. If we use the HGDP Pathans and 1000genomes British averages to estimate HRP0180's recent ancestry, we get 45.5% Pashtun and 54.5% British. So it seems that the HGDP Pathan samples are reasonable for at least this individual.

Recent Comments