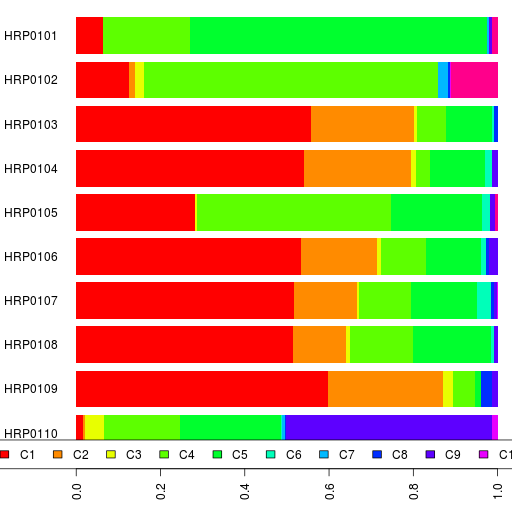
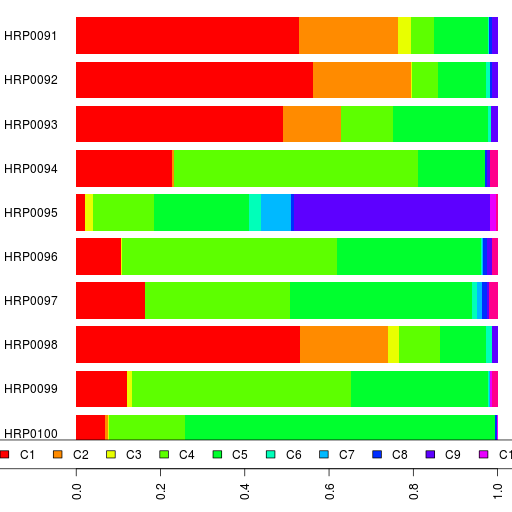
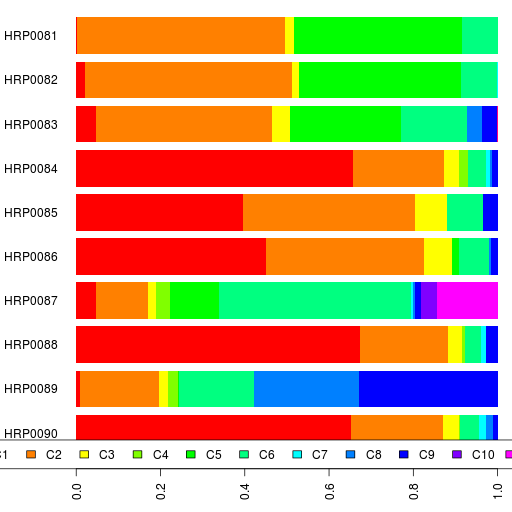
Here's my first admixture run using Reference 3 for Harappa participants. Since K=11 was the run with the Onge-ASI connection, I ran admixture at K=11 with all the 90 Harappa participants.
You can see the participant results in a spreadsheet as well as their ethnic breakdowns and the reference population results.
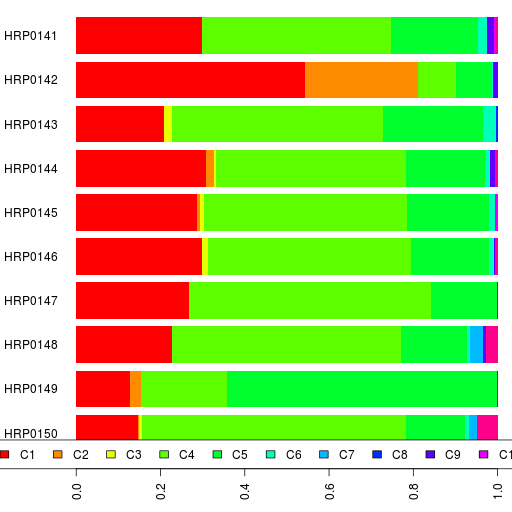
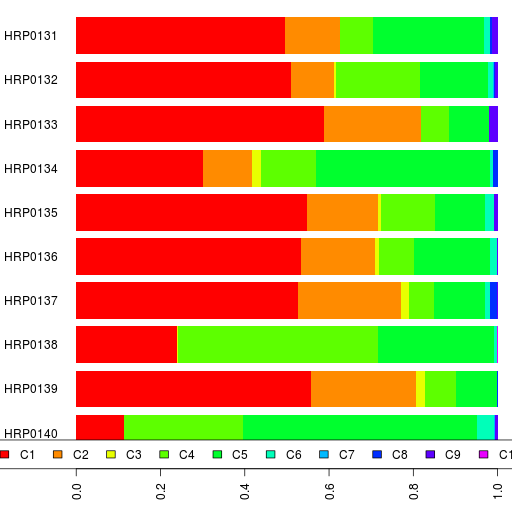
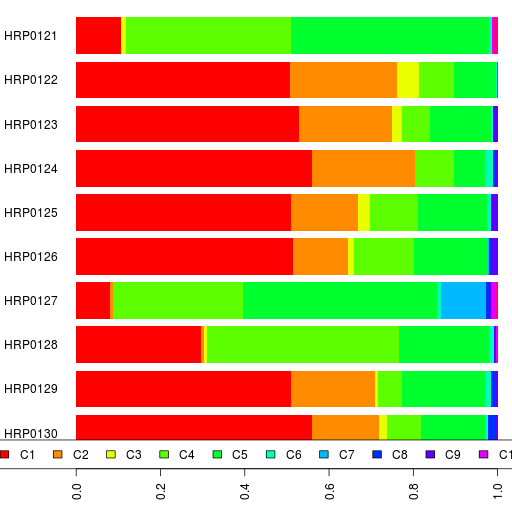
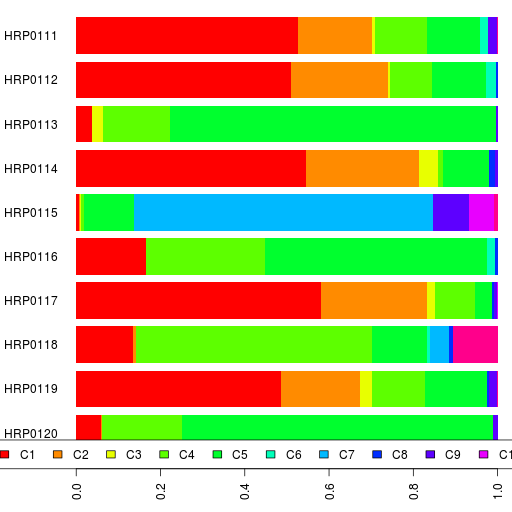
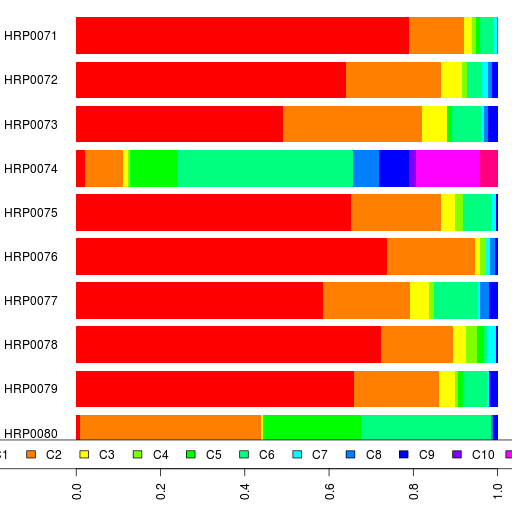
Here's our bar chart and table. Remember you can click on the legend or the table headers to sort.
Using the comparison between the Onge component here and Reich et al's Ancestral South Indian one, I get the following linear regression.

The correlation is 0.9949 which is probably as high as it can get. So let's calculate the ASI percentage for all the Harappa participants.
Note that I didn't calculate the ASI percentage for those who had a really low Onge component since the linear regression above would not be valid outside the range we have in our original data.
You can see the percentages in a spreadsheet too.
Let's compare with the Dodecad ANI-ASI results. I have 22.5% ASI here while it was 20.6% in the Dodecad analysis. Overall, it seems like my technique results in about 2% more ASI than Dodecad's, with a few exceptions: Like Razib who jumps from 34.3% to 43.3% (averaging his parents who are very close).


Recent Comments