Admixture (Ref3 K=11) HRP0201-HRP0210

Here are the admixture results using Reference 3 for Harappa participants HRP0201 to HRP0210.

You can see the participant results in a spreadsheet as well as their ethnic breakdowns and the reference population results.

Here's our bar chart and table. Remember you can click on the legend or the table headers to sort.

If the above interactive charts are not working, here's a static bar graph.

Do note that small percentages for your results can be noise.

My Phased Genome

I released my 23andme raw data last year. Since I had my parents also genotyped, I am now releasing my phased genome.

I haven't done anything with it yet. So if you have any ideas of what use I can put it to, chime in.

South Asian PCA 3D Plot

Here's a 3-D plot of my South Asian PCA run, showing the first three principal components.

The principal components have been scaled according to their respective eigenvalues. The plot is rotating about the vertical 1st eigenvector.

You can find out your position on the plot by using the dropdown below the plot and selecting your Harappa ID.

South Asian PCA Plots

I did a South Asian PCA + Mclust analysis last month. Here are the PCA plots from that analysis.

First, the eigenvectors are not scaled to the eigenvalues in the plots. So here's a table explaining how much each eigenvector is worth.

Eigenvector Percentage variation explained
1 1.134%
2 0.452%
3 0.351%
4 0.263%
5 0.254%
6 0.236%
7 0.228%
8 0.224%
9 0.215%
10 0.209%
11 0.207%
12 0.205%
13 0.203%
14 0.201%
15 0.198%
16 0.194%
17 0.191%
18 0.189%
19 0.189%
20 0.188%
21 0.188%
22 0.187%
23 0.186%
24 0.185%
25 0.184%
26 0.184%
27 0.183%
28 0.182%
29 0.180%
30 0.180%
31 0.179%
32 0.179%

Eigenvector 1 looks like the Indian cline but it's actually a West-East Eurasian cline. It's quite similar to Reich et al's Indian cline for their subset of populations (correlation between pc1 and ASI is 0.998869) but since East Asian is not separated out here due to the lack of any East Asian samples, we get a mix of East Asian and Ancestral South Indian towards the right of the plot.

Eigenvector 2 separates Kalash from everyone else.

Metspalu Ref3 Admixture Individual Results

I ran supervised admixture on the Metspalu et al dataset using my reference 3 data. AV asked for individual results, so here they are.

Here's the spreadsheet for Metspalu individual admixture results. You can compare with the reference 3 results.

Here's our bar chart. Remember you can click on the legend or the table headers to sort.

Metspalu Dataset Update

Dr. Metspalu, who has been very good about sharing data and information, has informed me about a couple of cases of mislabeling in the Metspalu et al dataset.

Our sample labelled D238 and reported as Tharu is in fact a Brahmin sample from Uttar Pradesh.

Following the publication we have identified that sample evo_32 was erroneously labelled as Kanjar before any genetic analyses. We hereby re-label the sample as belonging to Kol population.

Thus, I have updated the Metspalu admixture results and clustering results.

Happy New Year

Hope y'all have a great 2012! And that we see another fruitful year for personal genetics.berryjam.ru

I have been away over the holidays driving around the country and am just getting back to try to catch up with my email. I owe several people IDs which I'll send out by tomorrow.

South Asian PCA + Mclust

I combined reference 3 with Metspalu et al data and Harappa Ancestry Project participants (up to HRP0200). Then I kept only those individuals whose combined proportion of South Asian and Onge components on my reference 3 admixture results was more than 50%.

I ran PCA on these South Asian samples and kept 31 dimensions. Running Mclust on the PCA results gave me 37 clusters.

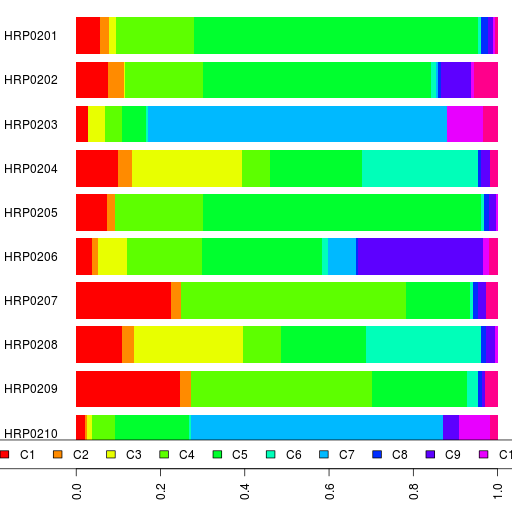
The clustering results are in a spreadsheet.

For an individual, the value under a specific cluster shows the probability of that person belonging to that cluster. For example, HRP0152 has a 58% probability of belonging to cluster CL8 and 42% probability of being in cluster CL14.

For the populations in the first sheet, I added up the probabilities of all the samples in that population to get the expected number of individuals of that ethnicity belonging to a specific cluster.

In the second sheet, I have listed all the individual samples' clustering results.

There are some outliers who didn't belong in any cluster: HRP0001 (me, of course), 7 (out of 18) Makranis, 4 (out of 23) Sindhis, 3 (all) Great Andamanese, 1 (out of 20) Balochi, 1 (out of 4) Madiga, and 1 (only) Onge.

Reference 3 + Yunusbayev + HAP PCA and Mclust

I ran Principal Component Analysis (PCA) on reference 3 along with Yunusbayev et al Caucasus dataset and Harappa Ancestry Project participants (up to HRP0200).

Then I ran mclust on the first 70 dimensions. The resulting 156 clusters can be seen in a spreadsheet.

For individuals belonging to Harappa Ancestry Project, the value in a column shows that person's probability of being in that cluster. So if there is a 1 in CL15 for example, then that person has a 100% probability of being in Cluster CL15.

For the reference population groups, I have added up the probabilities for all the individuals belonging to that group.

Yunusbayev Ref3 Admixture Results

I ran supervised admixture on the Yunusbayev et al dataset from the Caucasus using my reference 3 data to see how the Yunusbayev samples looked in my Ref3 admixture component space.

Here's the spreadsheet for Yunusbayev admixture results. You can compare with the reference 3 results.

Here's our bar chart for Yunusbayev results. Remember you can click on the legend or the table headers to sort.