Genetic Affinities of the Central Indian Tribal Populations

Genetic Affinities of the Central Indian Tribal Populations by Gunjan Sharma, Rakesh Tamang, Ruchira Chaudhary, Vipin Kumar Singh, Anish M. Shah, Sharath Anugula, Deepa Selvi Rani, Alla G. Reddy, Muthukrishnan Eaaswarkhanth, Gyaneshwer Chaubey, Lalji Singh, Kumarasamy Thangaraj:

Background
The central Indian state Madhya Pradesh is often called as ‘heart of India’ and has always been an important region functioning as a trinexus belt for three major language families (Indo-European, Dravidian and Austroasiatic). There are less detailed genetic studies on the populations inhabited in this region. Therefore, this study is an attempt for extensive characterization of genetic ancestries of three tribal populations, namely; Bharia, Bhil and Sahariya, inhabiting this region using haploid and diploid DNA markers.

Methodology/Principal Findings
Mitochondrial DNA analysis showed high diversity, including some of the older sublineages of M haplogroup and prominent R lineages in all the three tribes. Y-chromosomal biallelic markers revealed high frequency of Austroasiatic-specific M95-O2a haplogroup in Bharia and Sahariya, M82-H1a in Bhil and M17-R1a in Bhil and Sahariya. The results obtained by haploid as well as diploid genetic markers revealed strong genetic affinity of Bharia (a Dravidian speaking tribe) with the Austroasiatic (Munda) group. The gene flow from Austroasiatic group is further confirmed by their Y-STRs haplotype sharing analysis, where we determined their founder haplotype from the North Munda speaking tribe, while, autosomal analysis was largely in concordant with the haploid DNA results.

Conclusions/Significance
Bhil exhibited largely Indo-European specific ancestry, while Sahariya and Bharia showed admixed genetic package of Indo-European and Austroasiatic populations. Hence, in a landscape like India, linguistic label doesn't unequivocally follow the genetic footprints.

Did they seriously use only 48 AIMs (ancestrally informative markers) for their autosomal analysis?

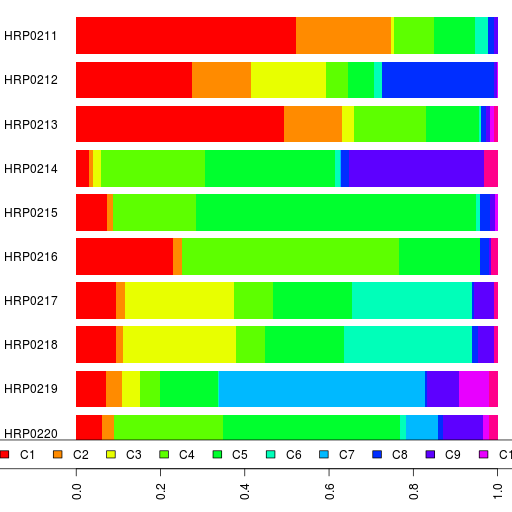
UPDATE: Here is their autosomal analysis using STRUCTURE on 48 AIMs.

Can't say I am impressed. It is very noisy. They have the African component varying from 6.2% to 13.2% in populations that should have none. They also have Bhil at 10.8% East Asian (I got 0%), Sahariya at 15.8% (me at 12%), and Gond at 9.2% (I got 7%).

In short, using 48 AIMs instead of 118,000 SNPs leads to really noisy results.

Xing Ref3 K=11 Admixture

Xing et al dataset is interesting because it has a number of South Asian populations:

  • 25 Andhra Pradesh Brahmin
  • 10 Andhra Pradesh Madiga
  • 11 Andhra Pradesh Mala
  • 22 Irula
  • 25 Nepalese
  • 25 Punjabi Arain
  • 14 Tamil Nadu Brahmin
  • 12 Tamil Nadu Dalit

Unfortunately, the dataset does not have a lot of common SNPs with 23andme, FTDNA and the other data I am using.

However, I did run a reference 3 admixture on Xing data using about 30,000 SNPs. Since this is a lot less than the usual 118,000 SNPs, the noise levels are much larger.

Here is the spreadsheet with the Xing group averages for reference 3 admixture at K=11 ancestral components.

Hodoglugil Dataset

Dr. Mahley was nice enough to share his Turkish and Kyrgyz dataset from the paper Turkish Population Structure and Genetic Ancestry Reveal Relatedness among Eurasian Populations by UÄŸur HodoÄŸlugil and Robert W. Mahley.

It has:

  • 16 Kyrgyz from Bishkek
  • 20 Turks from Aydin
  • 20 Turks from Istanbul
  • 23 Turks from Kayseri

Here are the group averages for the reference 3 K=11 admixture analysis.

And here are the individual results.

Harappa Participant Admixture Group Averages

I have been reporting only individual admixture results for Harappa Project participants. I think it's way past time I posted some group averages too.

You can see the groups I have assigned participants and the current count for each group.

The average admixture results for each group are in a spreadsheet. This is using Reference 3. You can compare with the reference population results.

Here's the bar chart for participants group averages. Remember you can click on the legend or the table headers to sort.

Dense South Asian ChromoPainter

I had run ChromoPainter/fineSTRUCTURE for 715 South Asians using only about 90,000 SNPs. I thought it would be a useful exercise to use more SNPs, so I had to drop the Reich et al dataset. That left me with 615 individuals and 418,854 SNPs.

The "chunkcounts" file has the donors in columns and recipients in rows. Here's a heat map of the same.

fineSTRUCTURE classified these 615 individuals into 89 clusters. I have named these clusters for convenience, however, the names do not imply that anyone in the Punjab cluster is Punjabi.

While I created the cluster tree at the top of the spreadsheet, here's how the clusters are related.

The most interesting thing is how Gujarati A (likely Patels) are an out-group to everyone else. Another major grouping is that of the Baloch, Brahui and Makrani, along with 4 Sindhis (might be one of the Baloch tribe of Sindh?).

The Punjabis, Sindhis and Pathan get better classification here than they did last time.

The Punjab cluster includes 3 Gujarati B, 4 Pathans, 2 Singapore Indians, Punjabis, Haryanvis, Kashmiris, and a Rajasthani Brahmin. Even using this method, HRP0036, who is half-Sri Lankan and half-German/Polish was classified in the same cluster.

The Dharkar and Kanjar could not be separated at all here. According to Metspalu:

There are three second degree relatives groups in our sample: ..snip.. [Kanjar evo_37 and Dharkar HA023]. Again the last pair needs further explanation. The Dharkar and Kanjar practice a nomadic lifestyle and were living side by side at the time of sampling. As the ethnic border between the two is permeable we cannot rule out neither our error during sample collection and/or subsequent labelling nor shifted self-identity.

The inter-cluster heat map:

And you can see the chunkcounts donated from each cluster to recipient individuals in a spreadsheet.

The pairwise coincidence:

And the PCA plots:

Admixture (Ref3 K=11) HRP0211-HRP0220

Here are the admixture results using Reference 3 for Harappa participants HRP0211 to HRP0220.

You can see the participant results in a spreadsheet as well as their ethnic breakdowns and the reference population results.

Here's our bar chart and table. Remember you can click on the legend or the table headers to sort.

If the above interactive charts are not working, here's a static bar graph.

Do note that small percentages for your results can be noise.

HRP0211 seems like a typical Tamil Brahmin.

HRP0212 is half-Fijian, half Indian/Pakistani/Afghan. It looks like his Fijian ancestry shows up as Papuan and East Asian mostly.

HRP0213 is a Gujarati Khoja whose results are not just different from the Gujarati Patels (Gujarati A) but also from HRP0130, a Gujarati Ganchi and HapMap Gujarati B.

HRP0216 is an Iraqi Assyrian and is a little more European than the other Assyrians. The Onge, Papuan and American are likely noise.

HRP0217 and HRP0218 are Kazakhs and fairly similar to the other Kazakhs in the project.

This will probably be the last admixture analysis using Reference 3.

Honesty in Participation

I am pretty lenient when it comes to participation in the Harappa Ancestry Project. I accept almost all comers, even those with no connection to South Asia and neighboring regions.

While I ask about ethnic background, I don't release it publicly unless I have consent from the participant.

I do expect a few things from project participants. One is that they will be honest about the information they share with me.

I see no need for anyone to lie about their ethnicity. It's better just to withhold that information if you are so concerned.

There is also no reason not to tell me if you have a close relative participating since I do accept data from relatives (with the proviso that only unrelated samples can be included in most analyses). It's possible that you might not know that a 1st or 2nd degree relative is already in the project. That's not a problem; knowing a relative is in the project and not telling me is.

Also if you send me genomes that are 95% identical (IBS2: 849,145 SNPs) under different names, I will know. And I will remove you from the project.

UPDATE: 849,145 SNPs being IBS2 (i.e. both alleles the same for the two individuals) is 92.5% of all the common SNPs in their data files. For comparison, my sister and I have an IBS2 percentage of only 76.8%.

Relatives in Datasets

Recently, there was a paper Identification of Close Relatives in the HUGO Pan-Asian SNP Database by Xiong Yang, Shuhua Xu, and the HUGO Pan-Asian SNP Consortium.

three individuals involved in MZ pairs were excluded from the whole dataset to construct standardized subset PASNP1716; seventy-six individuals involved in first-degree relationships were excluded from PASNP1716 to construct standardized subset PASNP1640; and 57 individuals involved in second-degree relationships were excluded from PASNP1640 to construct standardized subset PASNP1583. The individuals excluded were summarized in Table S6, S7, S8.

Let me engage in some blog triumphalism by saying I wrote about the duplicates and relatives in the Pan-Asian dataset in April 2011.

Here are my blog posts about relatedness in datasets:

Early on, I was removing only first degree relatives from the reference datasets. Nowadays, I try to remove all second degree relatives too. I leave the third degree relatives in the data since it's sometimes hard to figure out how real the low IBD values are in Plink. There are a lot of 3rd degree relatives if Plink is to be believed, but I am a little skeptical.

Since Plink's IBD analysis requires homogenous samples, I am now using KING (paper) for the purpose. I am also looking at kcoeff (paper)

ChromoPainter/fineStructure South Asians

You have probably heard of ChromoPainter/fineSTRUCTURE by now (Eurogenes, Dienekes, MDLP and Razib).

So I decided to run the South Asian samples data which I had earlier done PCA/MClust on through ChromoPainter and fineSTRUCTURE.

Here is the coancestry matrix among the 715 participants visualized as a heat map.

UPDATE: Here's a huge image showing the same.

fineSTRUCTURE can use this coancestry matrix to classify individuals into clusters, 52 in this case (compared to 38 using PCA and MClust). You can check the cluster assignments in a spreadsheet.

Note that I have named the clusters. That's just a shorthand so we don't have to refer to them by cluster number. Instead I used the population with the largest number of individuals in a cluster to label that cluster.

Here's the cluster-level coancestry heat map.

And the pairwise coincidence:

And finally PCA plots for the first 10 dimensions from fineSTRUCTURE.

UPDATE (Feb 9, 2012): New PCA plots with better markers for the clusters.

Project Anniversary

It has been one year for the Harappa Ancestry Project. I announced it on January 17, 2011 and then moved it to its own domain on January 19.

It started out fast and furious with participants sending their data every day and I was blogging it multiple times a day. Now it has slowed down quite a bit with only one South Asian unrelated participant (not counting any Romany) in the last 2 months.

Speaking of participants, there have been a couple of complaints.

The decision to include non-South Asian participants from countries that do not neighbour the Subcontinent contradicts the Harappa Project's original inclusion criterion.

I concur with DMXX. While I'm certainly not anyone to tell Zack how to run his own show, I think the project is losing it's original focus. Accepting folks from West-Asia was also fine, given that South-Asians derive a lot of ancient ancestry from the area and thus may be deemed a secondary focus area. The same could also be said for those with partial Roma Gypsy ancestry. But, some of the runs seem to be almost entirely dominated by non-South Asian participants, who have absolutely no connection with the subcontinent. I can't help but ask on what basis these Brazilian, Belizean, Mexican, Hispanic, Somali, African-American and European participants were accepted into the project.

My approach has been to make it clear to any potential participants that my focus is on South Asia. Thus any Admixture components I have computed have been with a heavily South Asian dataset. Also, a number of PCA and clustering analyses that I do are at times limited to South Asians etc. On the other hand, I have accepted any participant who has asked to be included. I run a basic Admixture run for everyone which is a fairly automated process and sometimes include them in other analyses.

Let me illustrate with an example. I am working on a new Admixture calculator. For computing the components, I am using all the South Asian project participants in addition to reference datasets. I am going to select the data for that in such a way that we get Admixture components which gives us a better idea of South Asian genetic ancestry.

While participation in the project has slowed down, the research on South Asian genetics has picked up. We had the Metspalu et al paper and dataset. Also. 1000genomes is expected to release 400 South Asian samples (100 Lahori Punjabis, 100 Bangladeshis, 100 Sri Lankan Tamil and 100 Indian Telegu) over the summer.