Category Archives: Admixture - Page 5

Harappa Participant Admixture Group Averages

I have been reporting only individual admixture results for Harappa Project participants. I think it's way past time I posted some group averages too.

You can see the groups I have assigned participants and the current count for each group.

The average admixture results for each group are in a spreadsheet. This is using Reference 3. You can compare with the reference population results.

Here's the bar chart for participants group averages. Remember you can click on the legend or the table headers to sort.

Admixture (Ref3 K=11) HRP0211-HRP0220

Here are the admixture results using Reference 3 for Harappa participants HRP0211 to HRP0220.

You can see the participant results in a spreadsheet as well as their ethnic breakdowns and the reference population results.

Here's our bar chart and table. Remember you can click on the legend or the table headers to sort.

If the above interactive charts are not working, here's a static bar graph.

Do note that small percentages for your results can be noise.

HRP0211 seems like a typical Tamil Brahmin.

HRP0212 is half-Fijian, half Indian/Pakistani/Afghan. It looks like his Fijian ancestry shows up as Papuan and East Asian mostly.

HRP0213 is a Gujarati Khoja whose results are not just different from the Gujarati Patels (Gujarati A) but also from HRP0130, a Gujarati Ganchi and HapMap Gujarati B.

HRP0216 is an Iraqi Assyrian and is a little more European than the other Assyrians. The Onge, Papuan and American are likely noise.

HRP0217 and HRP0218 are Kazakhs and fairly similar to the other Kazakhs in the project.

This will probably be the last admixture analysis using Reference 3.

Admixture (Ref3 K=11) HRP0201-HRP0210

Here are the admixture results using Reference 3 for Harappa participants HRP0201 to HRP0210.

You can see the participant results in a spreadsheet as well as their ethnic breakdowns and the reference population results.

Here's our bar chart and table. Remember you can click on the legend or the table headers to sort.

If the above interactive charts are not working, here's a static bar graph.

Do note that small percentages for your results can be noise.

Metspalu Ref3 Admixture Individual Results

I ran supervised admixture on the Metspalu et al dataset using my reference 3 data. AV asked for individual results, so here they are.

Here's the spreadsheet for Metspalu individual admixture results. You can compare with the reference 3 results.

Here's our bar chart. Remember you can click on the legend or the table headers to sort.

Metspalu Dataset Update

Dr. Metspalu, who has been very good about sharing data and information, has informed me about a couple of cases of mislabeling in the Metspalu et al dataset.

Our sample labelled D238 and reported as Tharu is in fact a Brahmin sample from Uttar Pradesh.

Following the publication we have identified that sample evo_32 was erroneously labelled as Kanjar before any genetic analyses. We hereby re-label the sample as belonging to Kol population.

Thus, I have updated the Metspalu admixture results and clustering results.

Yunusbayev Ref3 Admixture Results

I ran supervised admixture on the Yunusbayev et al dataset from the Caucasus using my reference 3 data to see how the Yunusbayev samples looked in my Ref3 admixture component space.

Here's the spreadsheet for Yunusbayev admixture results. You can compare with the reference 3 results.

Here's our bar chart for Yunusbayev results. Remember you can click on the legend or the table headers to sort.

Metspalu Ref3 Admixture Results

I ran supervised admixture on the Metspalu et al dataset using my reference 3 data. Here's the spreadsheet for Metspalu admixture results. You can compare with the reference 3 results.

Here's our bar chart for Metspalu results. Remember you can click on the legend or the table headers to sort.

These are very different from Dienekes for some reason.

UPDATE (Dec 13 10:04am): I found a major error. I had used the population info file I had downloaded from the paper instead of my reformatted one and thus I had not merged that info with the correct IDs with the admixture results. So the previously posted results were junk. I have fixed that now and the results are as expected.

Admixture (Ref3 K=11) HRP0191-HRP0200

Here are the admixture results using Reference 3 for Harappa participants HRP0191 to HRP0200.

You can see the participant results in a spreadsheet as well as their ethnic breakdowns and the reference population results.

Here's our bar chart and table. Remember you can click on the legend or the table headers to sort.

If the above interactive charts are not working, here's a static bar graph.

HRP0193 is Georgian and has very similar results to HRP0138 and HRP0175.

HRP0200 is Kazakh and is closely related to HRP0089. Thus the difference there (American, Onge & Papuan components) is somewhat interesting, though not high enough to be certain that it's not noise.

HRP0197 and HRP0198 are Somali. HRP0197 pointed out to me that 14S_R1, a Somali in the reference set, was an outlier who was more like East African Bantu (e.g., Luhya) than the other reference Somalis. So in the table below, I have excluded 14S_R1 for the average.

Component RefAverage HRP00197 HRP00198
S Asian 0 2 2
Onge 4 0 1
E Asian 0 1 2
SW Asian 28 33 34
European 0 0 0
Siberian 0 2 1
W African 12 14 13
Papuan 0 0 0
American 0 0 1
San/Pygmy 2 3 2
E African 52 44 43

Interestingly, the two project participants are more Asian than the reference average.

Ref3 + Yunusbayev Harappa Admixture Results

The ADMIXTURE results for the Harappa participants (up to HRP0180) for the Reference 3 + Yunusbayev dataset are in a spreadsheet and can also be seen in the bar charts below.

Do take a look at K=12 and K=17 (lowest crossvalidation errors) as well as K=15.

Ref3 + Yunusbayev Caucasus Data Admixture

To my standard reference 3 (list of populations), I added the Yunusbayev et al Caucasus samples which include the following:

  • 20 abhkasians
  • 16 armenians
  • 19 balkars
  • 13 bulgarians
  • 20 chechens
  • 14 kumyks
  • 6 kurds
  • 15 mordovians
  • 16 nogais
  • 15 north-ossetians
  • 15 tajiks
  • 15 turkmens
  • 20 ukranians

These 204 samples increased the total to 4,090.

Then I applied a stricter IBD relationship cutoff than I have before. Previously my focus was on removing relatives, but now I wanted to remove samples that seemed highly inbred or belonged to highly bottle-necked small groups so they would not create their own clusters in Admixture. This process removed the following 164 samples:

  • maasai 30
  • papuan 15
  • karitiana 12
  • pima 12
  • onge 8
  • surui 7
  • luhya 6
  • melanesian 6
  • colombian 5
  • hadza 5
  • koryaks 5
  • sandawe 5
  • san 4
  • turkmens 4
  • african-americans 3
  • east-greenlanders 3
  • great-andamanese 3
  • nganassans 3
  • chenchu 2
  • evenkis 2
  • han-chinese-south 2
  • maya 2
  • mbutipygmy 2
  • mexicans 2
  • utahn-whites 2
  • aus 1
  • bantukenya 1
  • british 1
  • chinese-americans 1
  • gujaratis-b 1
  • iranians 1
  • naxi 1
  • north-kannadi 1
  • samaritians 1
  • she 1
  • tuvinians 1
  • yemenese 1
  • yoruba 1
  • yukaghirs 1

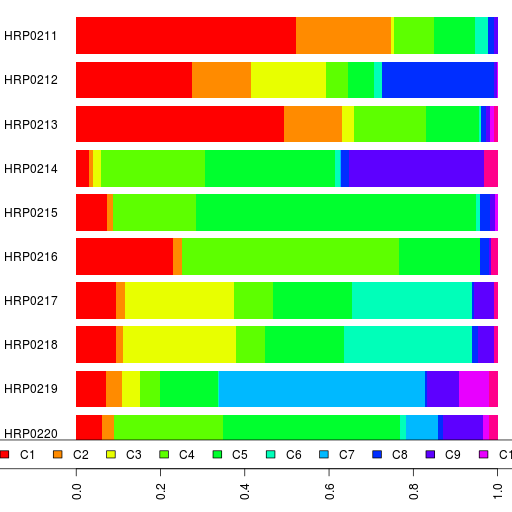
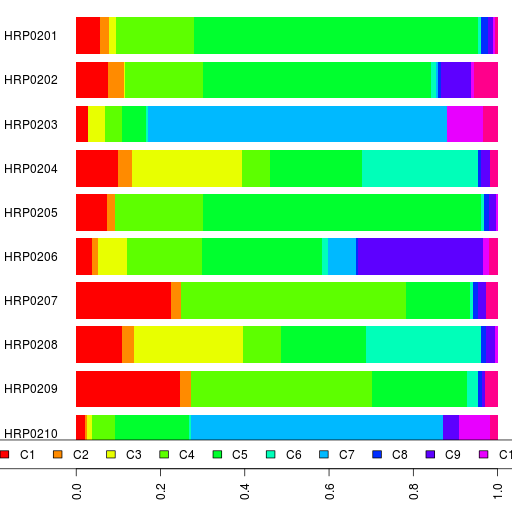
Finally, I added the 165 founders from the Harappa Project participants (up to HRP0180).

The crossvalidation error for the admixture results with K (number of ancestral components) from 2 to 20 is plotted here.

Zooming in,

The lowest crossvalidation errors are for K=17 and K=12.

The admixture results are in a spreadsheet.

In addition to K=17 and K=12, take a look at the results for K=15.

PS. I should point out that the names for the ancestral components are just useful mnemonics based on the current distribution of that component. Also, a component with the same name at one value of K is different from a similarly named component at another K.