Author Archives: Zack - Page 4

23andme Now $99

Things have been very busy in meatspace in recent months, but I am finally back.

While the submission of data from new participants has really slowed, the release of new software continues unabated. I hope to try some of them (ALDER, MULTIMIX, ADMIXTOOLS, etc.) out and report anything interesting here.

Another disappointment has been the 1000genomes South Asian data which is still nowhere to be seen.

However, 23andme has reduced its regular price to $99 which should induce some of you to test and participate.

The Genographic Project has finally gotten into autosomal testing. If you are South Asian and have received their Geno 2.0 results, I would be interested in your raw data so that I can check how many SNPs it has in common with HarappaWorld.

Eurasian ChromoPainter Chunk Counts

Continuing with the Eurasian ChromoPainter analysis, here is the zip file containing the chunk counts that were donated by an individual in a column to an individual in a row. Please note that this is an all-against-all analysis, so it does not directly show the direction of gene flow. Also, the IDs I used here are based on ethnicity (except for harappann which are mixed Harappa Project participants). If you want to find out your ethnicID, take a look at this spreadsheet which has the appropriate mapping.

Since fineStructure classified these 2,001 individuals into 203 populations, it's easier to look at the chunk counts averaged over these populations.

From top to bottom (recipient) and left to right (donor), the five major branches are South Asian, European, Near Eastern & Western Asian, Inner Asian/Siberian, and East Asian respectively.

This population chunk count data is available in a spreadsheet.

Now, let's look at some specific recipient clusters/populations.

Here's the top 50 populations that have donated chunks to the Kalash (Pop133).
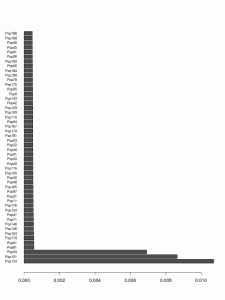
The three bars at the bottom are for the 3 different (closely related) Kalash clusters. The clusters donating the most after that are the Burusho, Sindhi, Pathan, etc. The top non-South Asian donor (Tajik Pop116) is at #21 and the next one is also Tajik (Pop95) at #38.

Now here are the top donors for the Pathans (Pop148).

Interestingly, the number of chunks donated to Pathans from Balochi, Brahui and Sindhi seems to be a bit more than from Punjabis. Again, Tajiks are the closest non South Asian group at #55 and #59, followed by Kurds at #62 and Iranians/Kurds cluster (Pop172) at #63.

Now let's look at the donors for Pop134 which includes 2 Bhatia, 2 Gujarati-B, 3 Haryana Jatt, 1 Kashmiri, 4 Pathan, 5 Punjabi, 1 Punjabi Brahmin, 5 Punjabi Jatt, 2 Punjabi Ramgarhia, 1 Rajasthani Brahmin, 1 Sindhi and 3 Singapore Indians.
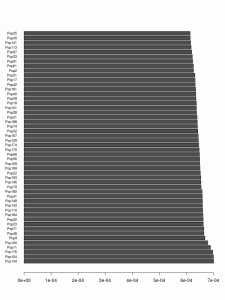
The top donors (other than Punjabis, of course) are Sindhis and Gujarati-B. The top non South Asian donors are Tajiks at #65 & #67, Iranians/Kurds at #69, Turkmen at #70, Kurds at #73 and Lezgin at #75.

Now for Pop181 (2 Baloch and 9 Brahui).

The Baloch/Brahui are more inbred compared to Punjabis and Pathans. After teh top donors from Baloch, Brahui and Makrani, we get Sindhis, Pathans, Velama and Punjabis. The top non South Asian donor populations are Iranian/Kurd at #28, Turkmen at #33, Turk/Kurd (Pop162) at #35, Iranian Jews at #39, Kurd at #41, a lone Saudi at #42, Iraqi Jews at #43, Tajik at #44, Drue at #47, Armenians at #48, and Samaritian at #50. So it seems like Baloch and Brahui are a lot more West Asian than other groups in Pakistan/NW India.

Let's look at the donors for Pop129 (1 Tamil Nadu Brahmin, 4 Iyengar Brahmin, 8 Iyer Brahmin, and 9 Singapore Indians).

The top donors, after Pop129, are Iyengar Brahmins and a group consisting of other South Indian Brahmins, Kerala Christiand and Nairs, and then Velama. The Dusadh are the top north Indian donor, followed by Gujarati-B and Chamar. Top non South Asian donor is Tajik at #73.

Now for the top donors for Pop188 which includes 33 Singapore Indians, 4 Tamil Vellalar, 3 Andhra Pradesh Reddy, 2 Andhra Pradesh, 2 Dusadh, 2 Karnataka, 2 Sinhalese, 2 Tamil Nadar, 2 Tamil Nadu Scheduled Caste, 1 Chenchu, 1 Kerala Christian, 1 Kerala Muslim, 1 North Kannadi, 1 Tamil Muslim, 1 Tamil Vishwakarma and 1 Velama.

The top donors are Sakilli, Piramalaikallar, and Velama. Their top non South Asian donor is a group of 5 Singapore Malays at #72, followed by Romanian and Serbian Romany at #73.

Finally, let's see which clusters are the top donors for Paniya (Pop65) who get the most South Indian component in my HarappaWorld Admixture runs.

Their top donors are Paniya, Malayan, Pulliyar and Kurumba. Their top non South Asian donors are Singapore Malays at #55, Burmanese at #59, and Cambodian/Singapore Malay at #64.

Eurasian fineStructure Dendrograms

The dendrogram in the last post about Eurasian ChromoPainter/fineStructure analysis is a little hard to make sense of, so here is the same info in a better format.

First, the upper portion showing the relationship of the five branches:

Now, let's take a look at Branch1 which consists of South Asians:

Branch2 is European.

Branch3 is mostly the Near East and western Asia.

Branch4 is Inner Asia/Siberia.

And Branch5 is East Asian.

Note that the leaf labels consist of ethnicity followed by the number of that group who belong to that particular cluster. However, some of the labels are cut off in the images since they were long.

Eurasian ChromoPainter Analysis

Some months ago, I decided to run a big ChromoPainter analysis of the Eurasian samples I have. I removed from my dataset not only all Sub-Saharan Africans, but also North Africans and anyone else with more than 2% African admixture (which unfortunately included me).

Since the number of samples was still too large, I picked 25 random individuals from each non-South-Asian ethnicity while keeping all South Asians. I also tried to remove all close relatives and those with a high missing genotyping rate.

In the end, I had 254,576 SNPs for 2,001 samples belonging to 197 ethnic groups.

I ran ShapeIT to phase their genomes and then ChromoPainter and fineStructure. The whole process took about 2 months.

Then I got busy and the results sat on my computer for more than a month.

Now let's look at the ChromoPainter/fineStructure analysis. Due to my time constraints, I am going to present them in several posts.

Today, let's look at the fineStructure clustering run on the chunkcount output of ChromoPainter. It divided the individuals into 203 populations. Here's the spreadsheet containing the group and individual population clustering.

And here is the dendrogram showing the relationship of the clusters/populations computed by fineStructure.

UPDATE: Better dendrograms

23andme $50 Off

23andme has a $50 off coupon sale for three days. Here's the email I got from them:

Visiting family this summer? Are they part of 23andMe? Take advantage of our summer discount: $50 OFF each kit you purchase. This offer expires in 3 days (11:59PM PDT, Sunday August 12, 2012).

To use this code, visit our online store and add an order to your cart. Click "I have a discount code" and enter the code below.

$50 off Discount code: VMQ6KG

HarappaWorld HRP0250-HRP0252

I have added the HarappaWorld Admixture results for HRP0250-HRP0252 to the individual spreadsheet.

However, I have not recomputed the weighted averages for the Kashmiris or Bengali Brahmins. Also, I am not sure about Tamil Gounder. Wikipedia says they are Vellalars, but I don't know if I should report separate Gounder results or include in the Tamil Vellalar average.

Do note that the admixture components do not necessarily represent real ancestral populations. Also, the names I have chosen for the components should be thought of as mnemonics to ease discussion. I chose them based on which populations in my data these components peaked in. They do not tell anything directly about ancestral populations. The best way to look at these admixture results is by comparing individuals and populations. Finally, the standard error estimates on these results can be about 1%. Therefore, it is entirely possible that your 1% exotic admixture result is just noise.

FTDNA Summer Sale

FTDNA is having a sale on its DNA tests till July 15, 2012.

Their autosomal test, Family Finder, which can be submitted to Harappa Ancestry Project, is on sale for $199 instead of a regular price of $289.

In addition, their mtDNA and Y-DNA products are also discounted till end of day July 15.

HarappaWorld HRP0245-HRP0249

I have added the HarappaWorld Admixture results for HRP0245-HRP0249 to the individual spreadsheet.

I have also recomputed the weighted averages for Kurds (from 6 to 10 now).

Do note that the admixture components do not necessarily represent real ancestral populations. Also, the names I have chosen for the components should be thought of as mnemonics to ease discussion. I chose them based on which populations in my data these components peaked in. They do not tell anything directly about ancestral populations. The best way to look at these admixture results is by comparing individuals and populations. Finally, the standard error estimates on these results can be about 1%. Therefore, it is entirely possible that your 1% exotic admixture result is just noise.

Let's look at the Kurdish results from Yunusbayev (prefix: kurd), Xing (prefix: F) and Harappa (prefix: HRP). Do note that the Xing results were computed with a smaller number of SNPs and thus might be noisy.

Pagani East African Dataset

Pagani et al analyzed Ethiopian genetics in their paper "Ethiopian Genetic Diversity Reveals Linguistic Stratification and Complex Influences on the Ethiopian Gene Pool". Their dataset consisting of Ethiopians and a few other East African populations is available online.

I have analyzed the Pagani dataset with my HarappaWorld admixture calculator and included the results in my regular spreadsheet.

The group (weighted mean) results are also shown in the usual interactive bar chart below. You can click on the component labels to sort by that ancestral component.

Because the East African component as computed in HarappaWorld is maximum among the Maasai and several of the Pagani dataset populations have a higher percentage of that component, we should be a bit careful with interpreting the HarappaWorld results for the Pagani groups. I'll likely include them in my next iteration of the admixture calculator.

ANI-ASI Admixture Dating

Similar to an earlier conference poster, Reich Lab's Priya Moorjani et al have another poster at SMBE. Here's the abstract:

Estimating a date of mixture of ancestral South Asian populations
Linguistic and genetic studies have demonstrated that almost all groups in South Asia today descend from a mixture of two highly divergent populations: Ancestral North Indians (ANI) related to Central Asians, Middle Easterners and Europeans, and Ancestral South Indians (ASI) not related to any populations outside the Indian subcontinent. ANI and ASI have been estimated to have diverged from a common ancestor as much as 60,000 years ago, but the date of the ANI-ASI mixture is unknown. Here we analyze data from about 60 South Asian groups to estimate that major ANI-ASI mixture occurred 1,200-4,000 years ago. Some mixture may also be older--beyond the time we can query using admixture linkage disequilibrium--since it is universal throughout the subcontinent: present in every group speaking Indo-European or Dravidian languages, in all caste levels, and in primitive tribes. After the ANI-ASI mixture that occurred within the last four thousand years, a cultural shift led to widespread endogamy, decreasing the rate of additional mixture.

I bolded the portion which seems new compared to the previous abstract.