Continuing with the Eurasian ChromoPainter analysis, here is the zip file containing the chunk counts that were donated by an individual in a column to an individual in a row. Please note that this is an all-against-all analysis, so it does not directly show the direction of gene flow. Also, the IDs I used here are based on ethnicity (except for harappann which are mixed Harappa Project participants). If you want to find out your ethnicID, take a look at this spreadsheet which has the appropriate mapping.
Since fineStructure classified these 2,001 individuals into 203 populations, it's easier to look at the chunk counts averaged over these populations.
From top to bottom (recipient) and left to right (donor), the five major branches are South Asian, European, Near Eastern & Western Asian, Inner Asian/Siberian, and East Asian respectively.
This population chunk count data is available in a spreadsheet.
Now, let's look at some specific recipient clusters/populations.
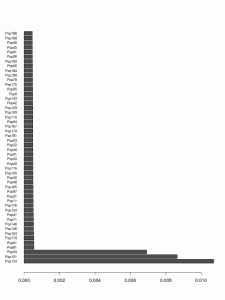
Here's the top 50 populations that have donated chunks to the Kalash (Pop133).

The three bars at the bottom are for the 3 different (closely related) Kalash clusters. The clusters donating the most after that are the Burusho, Sindhi, Pathan, etc. The top non-South Asian donor (Tajik Pop116) is at #21 and the next one is also Tajik (Pop95) at #38.
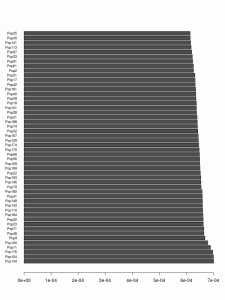
Now here are the top donors for the Pathans (Pop148).

Interestingly, the number of chunks donated to Pathans from Balochi, Brahui and Sindhi seems to be a bit more than from Punjabis. Again, Tajiks are the closest non South Asian group at #55 and #59, followed by Kurds at #62 and Iranians/Kurds cluster (Pop172) at #63.
Now let's look at the donors for Pop134 which includes 2 Bhatia, 2 Gujarati-B, 3 Haryana Jatt, 1 Kashmiri, 4 Pathan, 5 Punjabi, 1 Punjabi Brahmin, 5 Punjabi Jatt, 2 Punjabi Ramgarhia, 1 Rajasthani Brahmin, 1 Sindhi and 3 Singapore Indians.

The top donors (other than Punjabis, of course) are Sindhis and Gujarati-B. The top non South Asian donors are Tajiks at #65 & #67, Iranians/Kurds at #69, Turkmen at #70, Kurds at #73 and Lezgin at #75.
Now for Pop181 (2 Baloch and 9 Brahui).

The Baloch/Brahui are more inbred compared to Punjabis and Pathans. After teh top donors from Baloch, Brahui and Makrani, we get Sindhis, Pathans, Velama and Punjabis. The top non South Asian donor populations are Iranian/Kurd at #28, Turkmen at #33, Turk/Kurd (Pop162) at #35, Iranian Jews at #39, Kurd at #41, a lone Saudi at #42, Iraqi Jews at #43, Tajik at #44, Drue at #47, Armenians at #48, and Samaritian at #50. So it seems like Baloch and Brahui are a lot more West Asian than other groups in Pakistan/NW India.
Let's look at the donors for Pop129 (1 Tamil Nadu Brahmin, 4 Iyengar Brahmin, 8 Iyer Brahmin, and 9 Singapore Indians).

The top donors, after Pop129, are Iyengar Brahmins and a group consisting of other South Indian Brahmins, Kerala Christiand and Nairs, and then Velama. The Dusadh are the top north Indian donor, followed by Gujarati-B and Chamar. Top non South Asian donor is Tajik at #73.
Now for the top donors for Pop188 which includes 33 Singapore Indians, 4 Tamil Vellalar, 3 Andhra Pradesh Reddy, 2 Andhra Pradesh, 2 Dusadh, 2 Karnataka, 2 Sinhalese, 2 Tamil Nadar, 2 Tamil Nadu Scheduled Caste, 1 Chenchu, 1 Kerala Christian, 1 Kerala Muslim, 1 North Kannadi, 1 Tamil Muslim, 1 Tamil Vishwakarma and 1 Velama.

The top donors are Sakilli, Piramalaikallar, and Velama. Their top non South Asian donor is a group of 5 Singapore Malays at #72, followed by Romanian and Serbian Romany at #73.
Finally, let's see which clusters are the top donors for Paniya (Pop65) who get the most South Indian component in my HarappaWorld Admixture runs.

Their top donors are Paniya, Malayan, Pulliyar and Kurumba. Their top non South Asian donors are Singapore Malays at #55, Burmanese at #59, and Cambodian/Singapore Malay at #64.


Thanks for posting the Chunk counts file zack! This is very interesting. My results personally were not at all surprising. Here is my top 10 sorted from highest to lowest based on chunk counts:
singaporeindian218
singaporeindian231
iyerbrahmin10
singaporeindian214
iyengarbrahmin3
singaporeindian27
iyengarbrahmin7
brahmintamilnadu1
iyengarbrahmin6
iyerbrahmin4
If I remove all known samples from my same group(and arbitraryly random singapore indians), I get the following:
andhrapradesh1
northkannadi6
sindhi6
sakilli2
keralachristian3
savara1
maharashtrian1
asur1
andhrapradesh2
tamilvellalar4
I was wondering what you would get in such an analysis, if it was possible to remove ones own group from the calculations. E.g: Gujarati Patels analyzed for sharing without including any other Gujarati Patels. This this would be a computationally prohibitive proposition! But hypothetically, would the results be in the same order as removing all samples from ones own group from the chunk counts file you posted(similar to my second list)? or would statistical optimization provide a different result?
Thats a bit too high mathematics for me, i just you grouped me with tamil sheduled castes and adivasis for southindia
What are you talking about? You are romany1 and you are grouped with romanian3 and romanian7 in Pop85.
The new genetic study on roma gypsies (R1a founder lineage, and from northwest india) disprove as the lier you are Zack Ajmal. Story Teller. I want to be removed from your Project. Immediately. And now probably you will delete my comment because you are a Story teller and lier. Yes You Zack Ajmal!
Eliminate me from your List, and also my Raw Data! Im sorry I had trust in you.
I have no idea what prompted this temper tantrum.