Tag Archives: harappa - Page 5

Harappa Reference Population Similarity

I was not satisfied with the median IBS with reference populations method for checking how similar you are to different populations. So I took inspiration from Dienekes' population concordance ratio to compute another measure.

Let's say we have a Harappa participant h and we want to compare h to a reference population A. We can then divide our reference dataset into the in-group A and the out-group A' (which consists of everyone not in A). Now for every individual a belonging to group A and every individual a' belonging to group A', we can compare the IBS similarities and score them as:

The condition in this equation is true when Harappa participant h is more similar to individual a in population A than he is to individual a' who's not in population A and h and a are closer to each other than a is to a'.

We can then sum up these values over the whole set of populations A and A' and divide by the number of pairs .

This score tells us how similar h is to population A compared to all the reference samples not in population A and varies from 0 (most disimilar) to 1 (most similar).

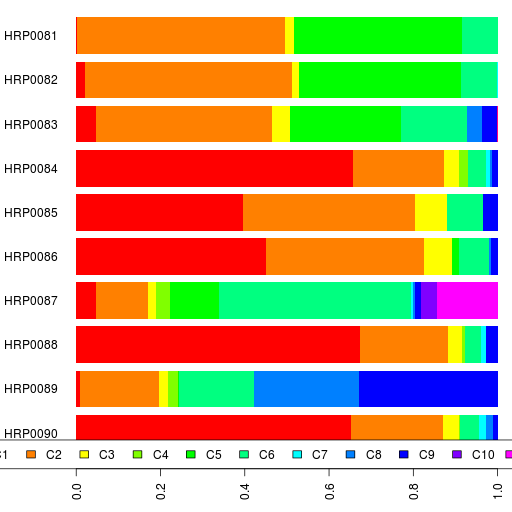
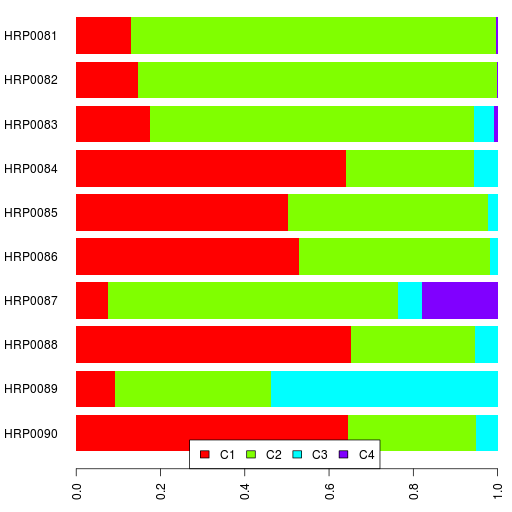
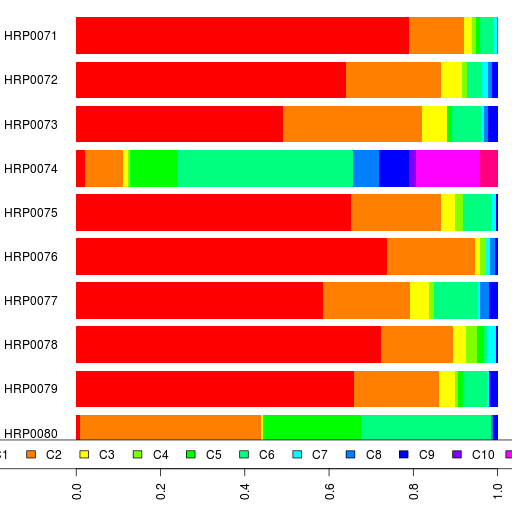
Let's see how the Harappa participants HRP0001 to HRP0089 score with the different reference 3 populations.

Go to the spreadsheet and click on your Harappa ID to sort the populations by your similarity score with them (click two times if you want to sort in decreasing order which I like better).

The first sheet Sheet1 has all the populations. In the Filtered 1 sheet, I removed 13 African populations that had really low similarity scores with all participants and recomputed the scores.

In Filtered 2, I further removed 9 populations (East Africa, America, Oceania) with low scores for everyone.

In Filtered 3, another 40 populations with low scores with at least 88 (out of 89) Harappa participants were removed. The reason I removed populations and recomputed is that this made the out-group not as different from the in-group as it was before. So we can check if this algorithm can provide us with some meaningful difference in scores with close populations.

In Filtered 4, another 25 populations were removed making it more South Asian centered.

Finally, I used the 68 unmixed South Asian Harappa participants and did a South Asian specific run (though I cheated a bit and kept myself HRP0001 and my sister HRP0035 in). The most interesting thing here is the really high score the Patel Gujaratis get with the Gujarati-A reference population.

Harappa Median IBS with Reference 3

You guys didn't like it the last time I did this and you are not going to like this either, but while I am thinking of solutions for posting closest individual IBS neighbors, here's another go at which reference populations have the best median IBS matches with you.

I used Reference 3 with about 100,000 SNPs for this IBS run.

Go to the spreadsheet and click on your ID in the column headers to sort by your similarity to the different reference populations.

UPDATE: I have added a transpose spreadsheet too, on Onur's request, so that you can sort which Harappa participant has higher or lower scores with a specific reference population.

Admixture K=12, HRP0081-HRP0090

Here are their ethnic backgrounds and the results spreadsheet. Also relevant are the reference I admixture results.

If you can't see the interactive bar chart above, here's a static image.

The two new Assyrians (HRP0081 & HRP0082) are pretty similar to the earlier Assyrian participant HRP0010.

HRP0087 is an interesting case with ancestry from France, Martinique, Madagascar and India. I can't be certain but the ratio of South Asian to Balochistan/Caucasus components seems to point in the direction of northern Indian ancestry. I definitely need to do a supervised admixture run for the mixed participants.

HRP0089 is Kazakh and has one-third Siberian component. That's higher than Uygurs (21%) and Uzbeks (23%) in my reference set. HRP0089 also has little bit more European component than the average Uygur or Uzbek in my reference.

PS. This was run using Admixture version 1.04.

Admixture K=4, HRP0081-HRP0090

Here are their ethnic backgrounds and the results spreadsheet. Also relevant are the reference I admixture results.

It would be interesting to see how the Kazakh and the mixed French/Madagascar/Martinique/Indian participants get on K=12.

If you can't see the interactive bar chart above, here's a static image.

PS. This was run using Admixture version 1.04 and using reference I. Probably the last batch for both.

PPS. For some reason, my efforts to reduce the font in the table are unsuccessful. Since we are close to 100 participants now, I need to find a better way for you guys to visualize these results. May be a slice at one time.

Harappa Nearest IBS Presentation

Since Dodecad posted nearest IBS (identity by state) neighbors, I have had requests to do the same for Harappa participants.

I have the data ready but I am not sure how to present it. I don't want to post an R object since I suspect most of you don't have it installed.

The idea is to give you a list of your closest IBS neighbors as well as your match percentage with them. How would you present that that for 90 people who might match any of several hundred (thousand?) reference samples too? Give me some ideas.

Harappa Genome Similarity MDS/Dendrogram

I computed the IBS similarity matrix for the Harappa participants HRP0001 to HRP0080 over 500,000 SNPs. This is exactly the same thing as the genome-wide gene comparison at 23andme.

Then, I converted the similarity matrix to a dissimilarity/distance matrix with the standard formula:

dij = sqrt(2 - 2 * sij)

where sij is the similarity between individuals i and j and dij is the distance/dissimilarity between the two.

Using the dissimilarity matrix, I classified all the participants (excluding close relatives) using hierarchical clustering with complete linkage. You can see the dendrogram below.

Then I used the same dissimilarity matrix to calculate 6-dimensional MDS. You can see the MDS plots below. The numbers on the plots are your Harappa IDs.

MDS Dimensions 1 & 2:

MDS Dimensions 3 & 4:

MDS Dimensions 5 & 6:

As you can see I (HRP0001) and my sister (HRP0035) are far away in the first four dimensions.

I'll let you guys speculate on what each dimension represents.

Now why create an MDS this way instead of directly using Plink's MDS functionality? Well, I needed to check if I could do it using only the similarity matrix because that would be really useful for something else. Tune in on my other blog for more later this week.

Harappa Gene Similarity

I was looking at Simranjit's DNA Tribes results and I thought I could provide you guys a list of how similar (part of) your genome is to different reference populations in a somewhat similar way to DNA Tribes results.

Basically, I computed an IBS (identity by state) matrix for all Harappa participants from HRP0001 to HRP0080 and my Reference II samples (info). These are the same as the Genome-wide comparison feature at 23andme.

Then I took the median similarity percentage between you and a reference population group. I found that median worked better here than mean as the mean was affected a lot by some outlier samples in the reference data.

Of course, since I am giving you a big discount compared to DNA Tribes, I am not doing a nice individual report. Instead, all you get is one spreadsheet including everyone. Click on your ID in the column headers to sort by your similarity to the different reference populations.

We see four outliers among the project participants who don't match any reference populations very well. One is HRP0074, a Brazilian, which is expected since I don't have any Native American populations. Then there are me (HRP0001) and my sister (HRP0035) which was well-known already. Finally, HRP0044, a Kashmiri.

Do note that this analysis was done using about 20,000 SNPs.

Harappa Admixture Dendrogram 1-80

It's time to update the Harappa admixture dendrogram since the last time I created one we had only 40 participants.

Note that this is not a phylogeny. It just visualizes the closeness of your admixture results to others.

Also note that I am using Euclidean distance between admixture proportions which has problems and using complete linkage hierarchical clustering.

Harappa Maps

Simranjit has generated new isopleth maps from the latest K=12 admixture run.

C1 South Asian:

C2 Balochistan/Caucasus:

C5 Southwest Asian:

C6 European:

Simranjit's also creating isoclusters now which classify different points/regions into clusters based on the admixture results Simran is using from here. Here's an isocluster map with 15 clusters inferred from the K=12 admixture results of reference populations and Harappa participants.

You can see the dendrogram showing the distance between the clusters on his blog.

Admixture K=12, HRP0071-HRP0080

Here are their ethnic backgrounds and the results spreadsheet. Also relevant are the reference I admixture results.

If you can't see the interactive bar chart above, here's a static image.

Since I don't have any Native American samples in my reference populations, the Brazilian participant (HRP0074) shows up as having Northeast Asian and Siberian.

PS. This was run using Admixture version 1.04.