Monthly Archives: May 2011 - Page 2

Reference 3 PCA Clustering for South Asians

Using the first 32 dimensions of the Reference 3 PCA, I tried to classify the 51 South Asian populations. I did not try a full clustering on all populations because that took too long and seemed like there were more than 150 clusters.

You can see the South Asians on 3-D PCA plots of the first four principal components.

The clustering results from Mclust are in a spreadsheet.

PS. I used 32 eigenvectors as that's what gave me the maximum number of clusters with a small number of outliers.

Admixture (Ref3 K=11) HRP0101-HRP0110

Here are the admixture results using Reference 3 for Harappa participants HRP0101 to HRP0110.

You can see the participant results in a spreadsheet as well as their ethnic breakdowns and the reference population results.

Here's our bar chart and table. Remember you can click on the legend or the table headers to sort.

If the above interactive charts are not working, here's a static bar graph.

HRP0101 has 1/8th Gujarati Patel ancestry but has 0% Onge component while the expected value would be about 3%. Also, his/her being 1/2 Romany is not reflected in a 70% European percentage.

HRP0105, an Iranian Kurd, is similar to the Iraqi Kurd HRP0059.

HRP0108, a Halai Bhatia, looks mostly like Punjabis and Sindhis in the admixture results.

HRP0110, Mexican/Jewish, is half Native American and likely a quarter Jewish.

Another Reference Admixture Set

From my Reference 3 dataset, I excluded the following populations for this set of admixture runs:

  • Biaka Pygmy
  • Mbuti Pymy
  • San
  • Bantu South Africa
  • Hadza
  • Chukchis
  • Koryaks
  • Colombian
  • Dominican
  • Ecuadorian
  • Karitiana
  • Maya
  • Mexican
  • Pima
  • Puerto Rican
  • Surui
  • East Greenlanders
  • West Greenlanders
  • Australian aboriginals
  • Melanesian
  • Papuan

The San and Pygmy were removed since they are very distinct and take up clusters and the South African Bantu because they have significant admixture from the San. The Hadza seem to be a unique population too.

The Chukchis and Koryaks are Beringian populations from the Russian Far East which separate from the Siberian and Turco-Mongol groups at higher K's.

I also excluded all the American populations because our focus is on South Asia and environs. I have a few participants with Amerindian ancestry and I can always run their analyses with the full reference 3.

The Papuans and Melanesians take up 2 ancestral components in admixture at times and since admixture works well only for about K<12 or so, those are precious. Also, I originally thought that South Asians (specifically the ASI) might have some affinity with Papuans but that hasn't borne out. In addition to removing these populations, I reduced the number of samples of various groups (except South Asian ones) to 25 individuals so that admixture won't rely too heavily on any of those large groups (like the 161 Yoruba). In selecting individuals from these populations, I chose those closest to the median in terms of their admixture results. 
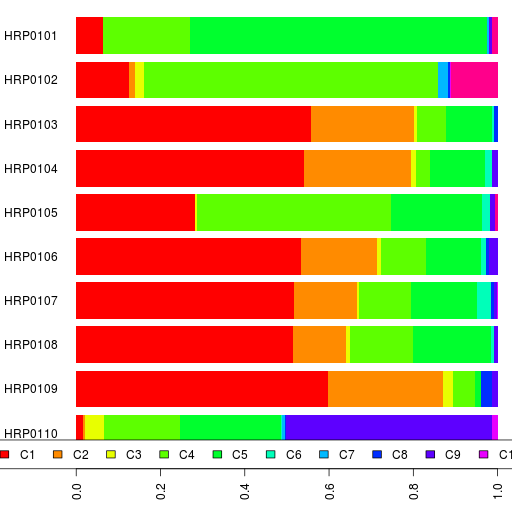
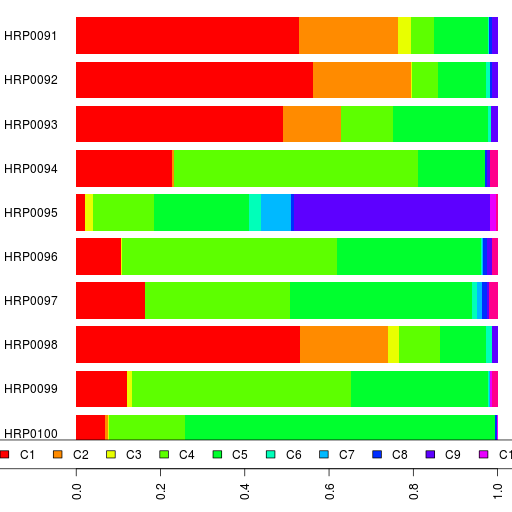
The admixture results of this dataset are in a spreadsheet as usual and the bar chart is below.

K=12 is the one with the lowest cross-validation error.

I am going to post another series of admixture runs tomorrow and then you guys can let me know which specific runs you like so we can switch to those for the project participants.

Reference 3 South Asians PCA

Let's zoom into the PCA plots of Reference 3 (more here) and look at how the different South Asian populations line up.

First the 3-D plot of eigenvectors 1, 2 & 3 with principal component 1 being vertical (and axis of rotation).

And now principal components 2, 3 & 4 (with the vertical axis of rotation being 2):

Note that I performed PCA on the whole set of reference 3, so you are looking at the axes of variation of all populations, not just South Asians.

More Reference 3 PCA 3D Plots

As per Razib's request, here is the 3-D plot of principal components 1, 2 & 4 for reference 3.

And here are principal components 2, 3 & 4:

Reference 3 PCA

Here's the Principal Component Analysis (PCA) of Reference 3 data.

First the 3-D plot of the first three eigenvectors. The plot is rotating about the 1st eigenvector which is vertical. Also, I have stretched the principal components based on the corresponding eigenvalues.

And now the plots of the first 24 principal components. Please note that the eigenvectors are not scaled by the corresponding eigenvalues in these plots (unlike the 3D plot).

Here are the first 24 eigenvalues (expressed as percentage of the sum of all eigenvalues):

6.417%
4.045%
0.746%
0.624%
0.336%
0.330%
0.296%
0.250%
0.218%
0.166%
0.140%
0.131%
0.119%
0.112%
0.108%
0.105%
0.098%
0.087%
0.086%
0.080%
0.075%
0.073%
0.073%
0.071%

Together, the first 24 eigenvectors explain 14.79% of the variation in the data.

According to the Tracy-Widom statistics from eigensoft, the number of significant principle components is 118.

UPDATE: I thought the eigenvectors 2 & 4 looked interesting for South Asians so I plotted them together.

Reference 3 Admixture Error Estimation

Since no one paid any attention to the error estimation results for reference I admixture, I am back with the standard error and bias estimates for reference 3 admixture.

So I ran the default 200 bootstrap replicates to measure standard error in our Reference 3 K=11 admixture. Spreadsheet with population level admixture results is here and participant results are here.

Here are some statistics for the standard error estimates:

Min. 1st Qu. Median Mean 3rd Qu. Max.
C1 S Asian 0 0.127 0.9848 0.7505 1.2216 1.6833
C2 Onge 0 0.2074 0.56 0.5404 0.8268 1.6914
C3 E Asian 0 0.2013 0.6123 0.6751 1.136 1.9961
C4 SW Asian 0 0.0874 1.1462 0.9246 1.5347 2.1008
C5 Euro 0 0.042 1.3034 0.9684 1.6582 2.3861
C6 Siberian 0 0.2054 0.6566 0.6712 1.0969 2.0099
C7 W African 0 0 0.01905 0.38847 0.75713 2.1588
C8 Papuan 0 0.1936 0.375 0.3648 0.5308 1.9627
C9 American 0 0.1461 0.3958 0.4646 0.6342 2.0831
C10 San/Pygmy 0 0 0.0708 0.2514 0.4471 2.0991
C11 E African 0 0 0.1235 0.3969 0.7315 1.9318

You can see the mean value of the standard errors per population and realize how many are over 1% (marked in red).

As the average error for the Onge component among South Asian populations is a little higher than 1%, the standard error on the ASI (Ancestral South Indian) computation here is about 1.4-1.5% just from admixture. The regression error is in addition to that.

And statistics for bias estimates:

Min. 1st Qu. Median Mean 3rd Qu. Max.
C1 -0.9069 -0.28408 -0.0349 -0.12196 0.01158 0.5856
C2 -0.7701 0 0.04005 0.03847 0.153 0.5703
C3 -0.5778 -0.0888 0.01645 0.02105 0.13737 0.6127
C4 -0.7701 -0.1657 0 -0.06692 0.01298 0.745
C5 -1.2917 -0.247675 0 -0.113631 0.008975 0.6763
C6 -0.7921 -0.0856 0.0129 0.009492 0.1198 0.6464
C7 -0.5745 0 0 -0.02173 0.0016 0.3426
C8 -0.1842 0.05328 0.13175 0.1377 0.21247 0.4712
C9 -0.4202 0.0096 0.0811 0.0915 0.1682 0.5129
C10 -0.4596 0 0.0002 0.003271 0.023425 0.3447
C11 -0.5766 0 0.0018 0.02276 0.05758 0.6346

You can also see the average value of the bias in each ancestral component for each population.

Admixture (Ref3 K=11) HRP0091-HRP0100

Here's my first admixture run using Reference 3 for Harappa participants with FTDNA data.

You can see the participant results in a spreadsheet as well as their ethnic breakdowns and the reference population results.

Here's our bar chart and table. Remember you can click on the legend or the table headers to sort.

If the above interactive charts are not working, here's a static bar graph.

Since this is my first analysis of FTDNA data, I asked HRP0006 to provide me with his FTDNA results (HRP0093) too so they can be compared. Let's see how that turned out.

HRP0006 HRP0093
C1 S Asian 49.31% 49.06%
C2 Onge 14.13% 13.70%
C3 E Asian 1.12% 0.00%
C4 SW Asian 14.65% 12.52%
C5 European 18.88% 22.44%
C6 Siberian 0.00% 0.78%
C7 W African 0.00% 0.00%
C8 Papuan 0.54% 0.01%
C9 American 1.35% 1.48%
C10 San/Pygmy 0.00% 0.00%
C11 E African 0.00% 0.00%

There are differences of up to 3% but generally the results are reasonably close.

HRP0095 and HRP0100 thought they had possible South Asian ancestry. That seems fairly unlikely at least in the last few generations since their Onge component is zero or very low.

Reference 3 Population Concordance

Dienekes had come up with a population concordance ratio which compared the IBS similarity percentages of a trio of individuals to compute the probability that two individuals from population A are more similar to each other than either is to any individual in population B.

Please note that

If two populations can be perfectly distinguished, then their population concordance ratio is 1. If however we randomly divide a set of individuals into two populations and try to calculate the population concordance ratio, we'll find it to be 0.25. It is possible for this ratio to be as low as zero.

If the concordance ratio between two populations is low, that does not necessarily mean that they are very similar. It's possible that a population does not form a tight cluster and has a lot of variation and thus is not distinguishable from another.

Now, here's the spreadsheet for the concordance ratios. You can focus on the South Asian population pairs here.

West, Central, South & Southeast Asian Admixture

Another set of admixture runs. This one uses the South Asian, Middle Eastern, Caucasian, Central Asian, Southeast Asian and Oceanian samples from Reference 3.

Basically I consider these to be our target populations. The idea is to build out from here by adding a few samples from other populations to make the results better.

Right now, the absence of African, European, East Asian and Siberian populations makes some of the other populations substitute for them. For example, Siddi works as African substitute while Aonaga works as East Asian substitute.

Here are the admixture results. You can choose the number of ancestral components, K, from the dropdown below.

I find K=11 and K=14 to be the most interesting. They have the two lowest cross-validation errors too.