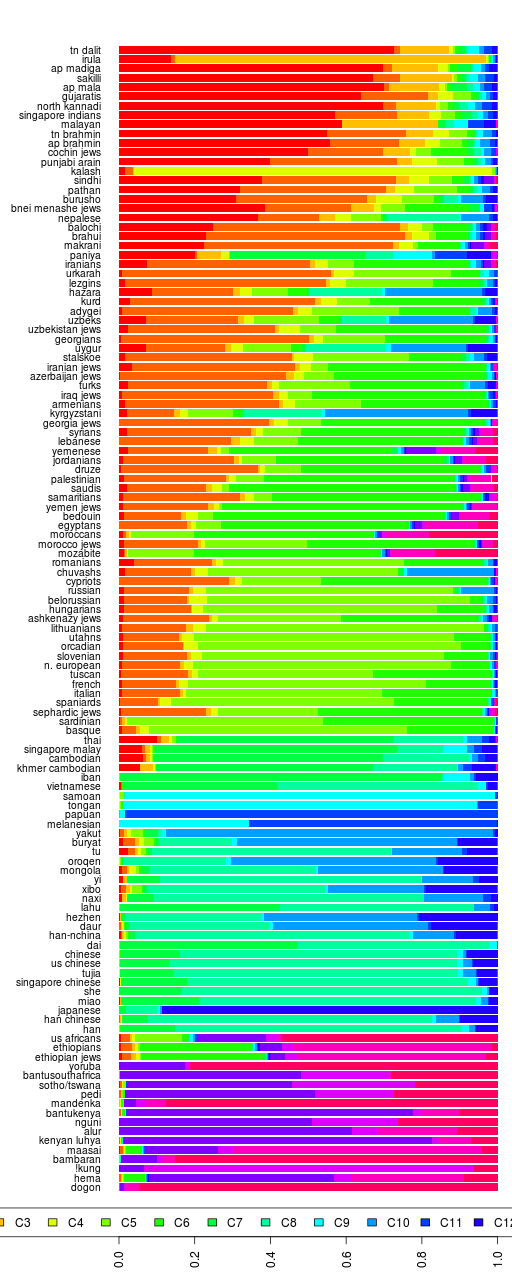
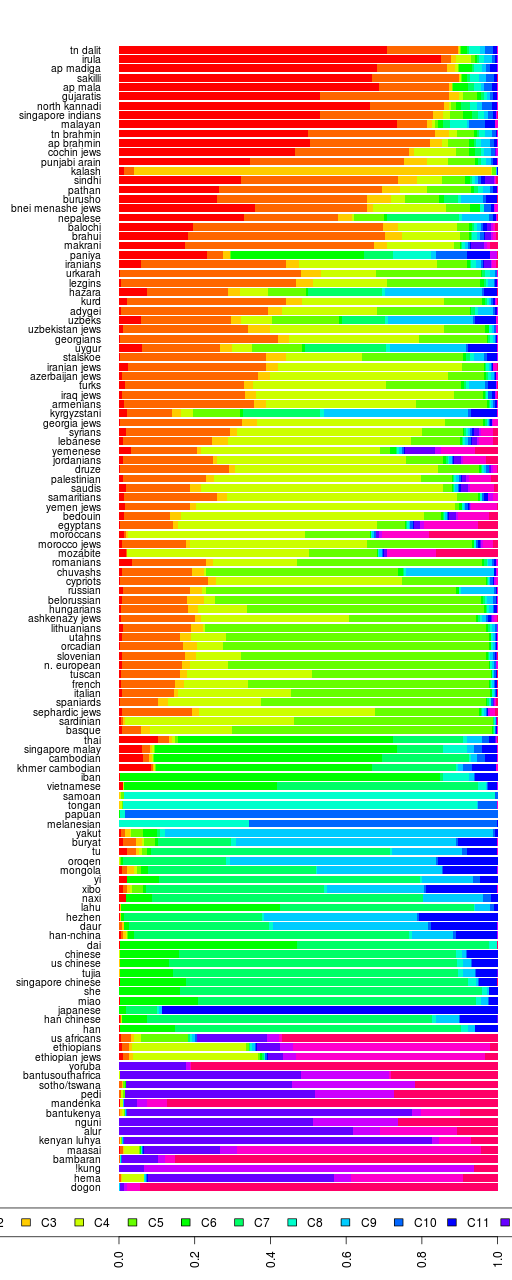
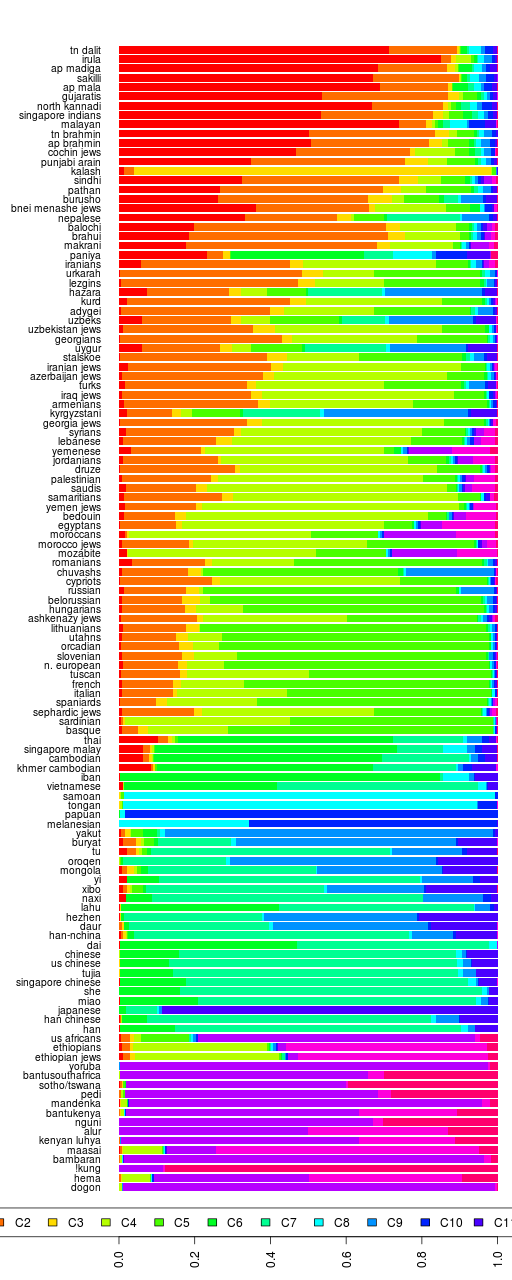
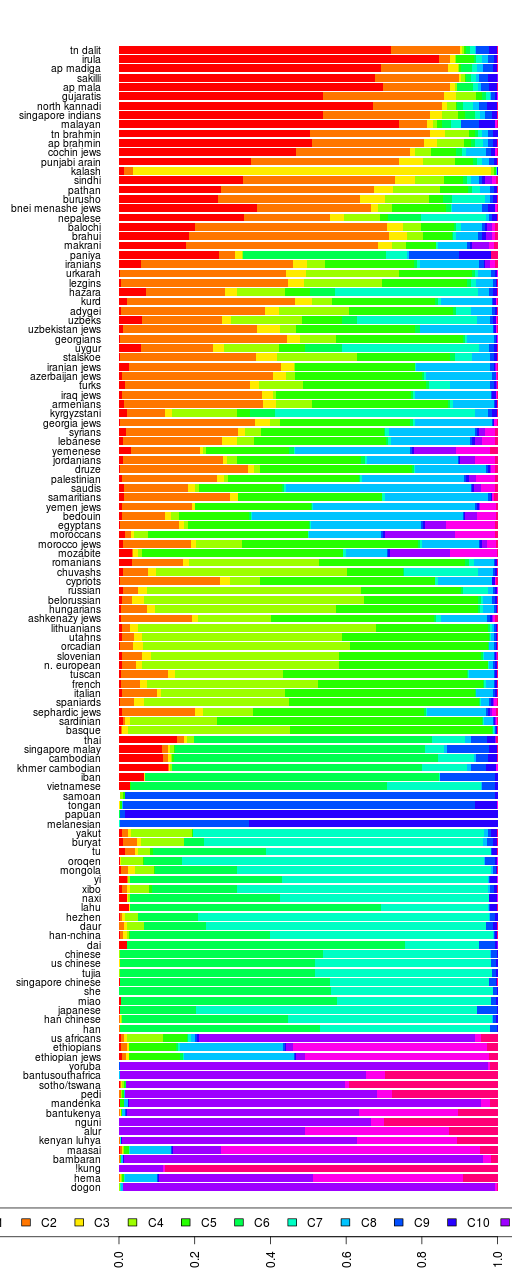
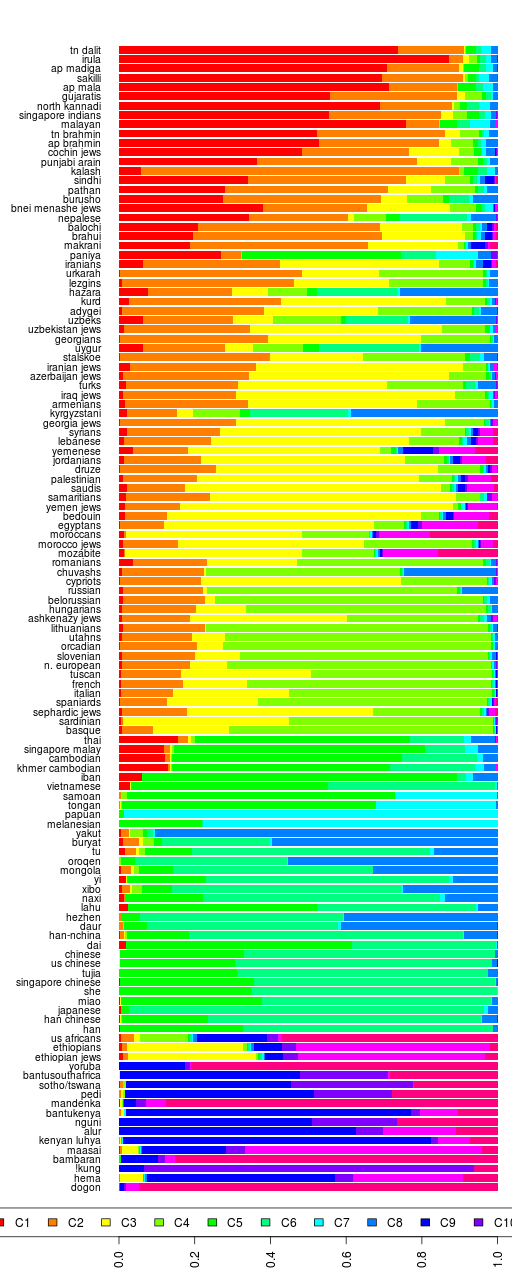
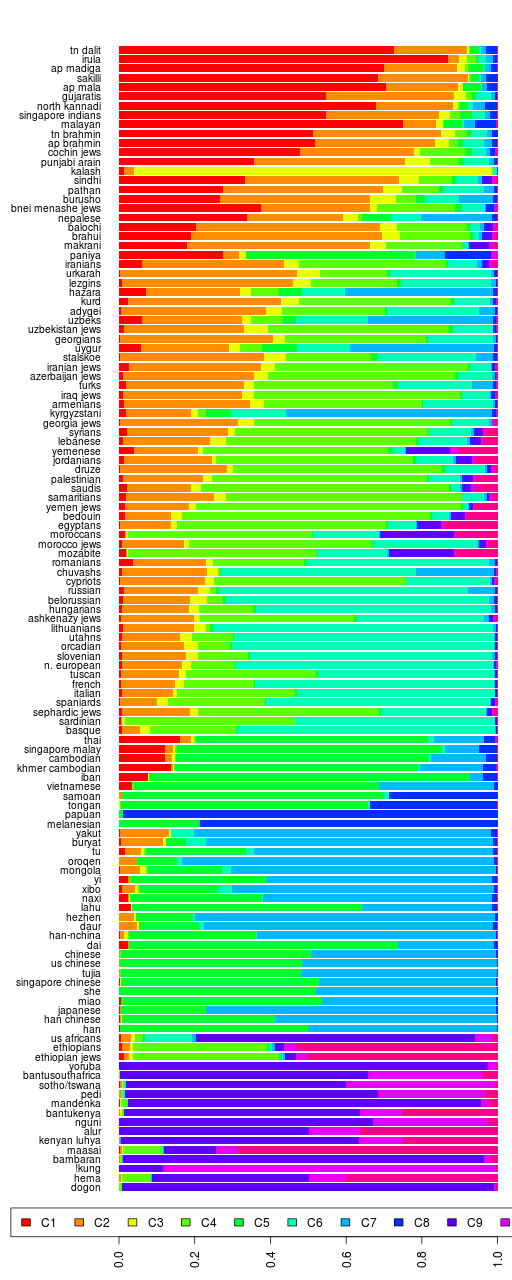
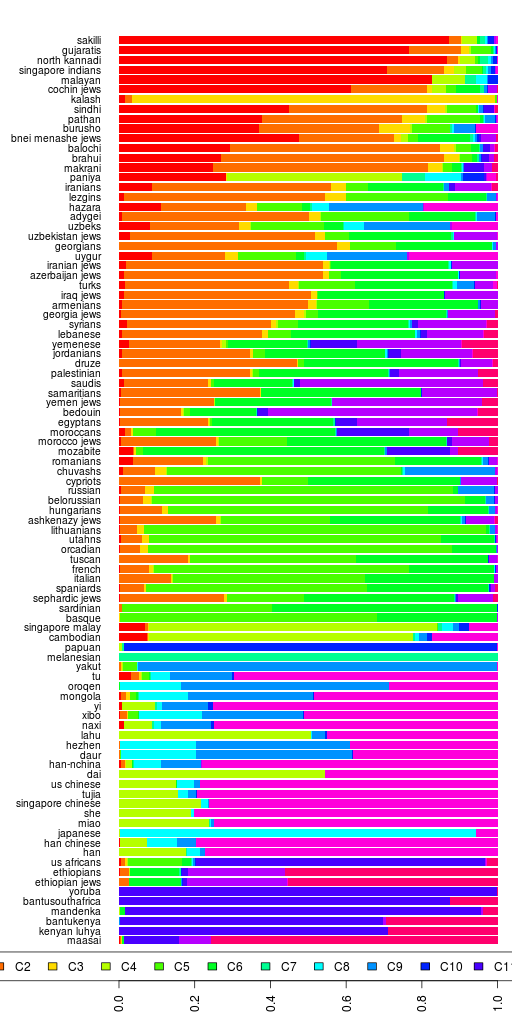
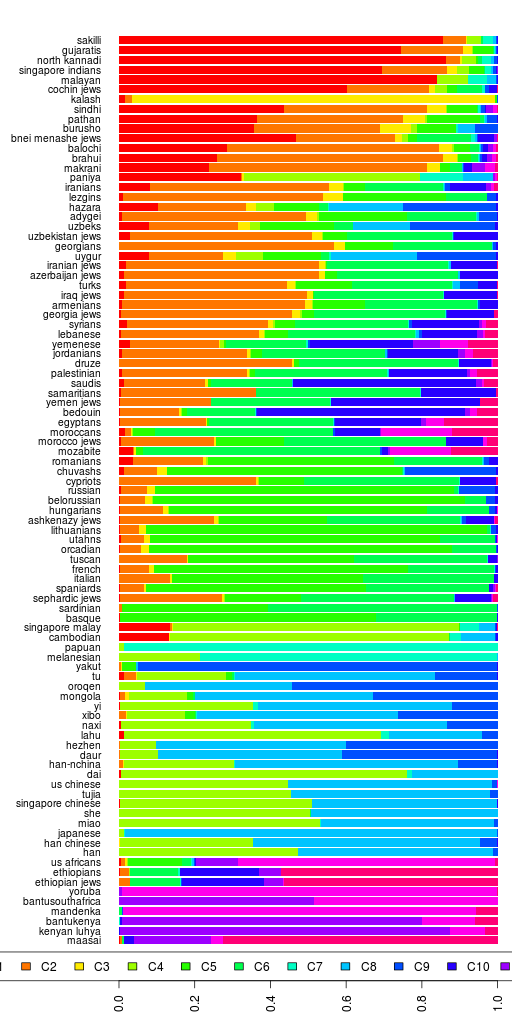
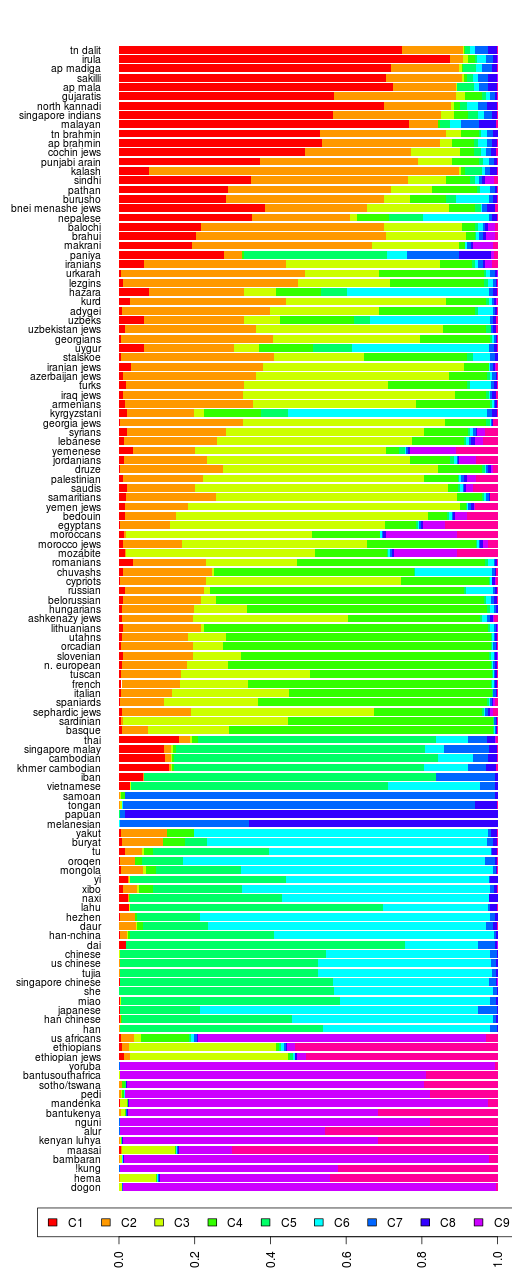
Continuing with Reference II admixture analysis, here is the results spreadsheet.
You can click on the legend to the right of the bar chart to sort by different ancestral components.
If you can't see the interactive chart above, here's a static image.
| C1 | South Asian | C2 | Balochistan/Caucasus |
|---|---|---|---|
| C3 | Irula | C4 | Kalash |
| C5 | European | C6 | Southwest Asian |
| C7 | Southeast Asian | C8 | Chinese |
| C9 | Polynesian | C10 | Siberian |
| C11 | Papuan | C12 | Japanese |
| C13 | Eastern Bantu | C14 | Bushman |
| C15 | East African | C16 | West African |
Fst divergences dendrogram between estimated ancestral populations for K=16:

PS. This was run using Admixture version 1.04 so I can make an apples-to-apples comparison with the previous runs.


Recent Comments