Continuing with Reference I admixture analysis, here is the results spreadsheet.
You can click on the legend to the right of the bar chart to sort by different ancestral components.
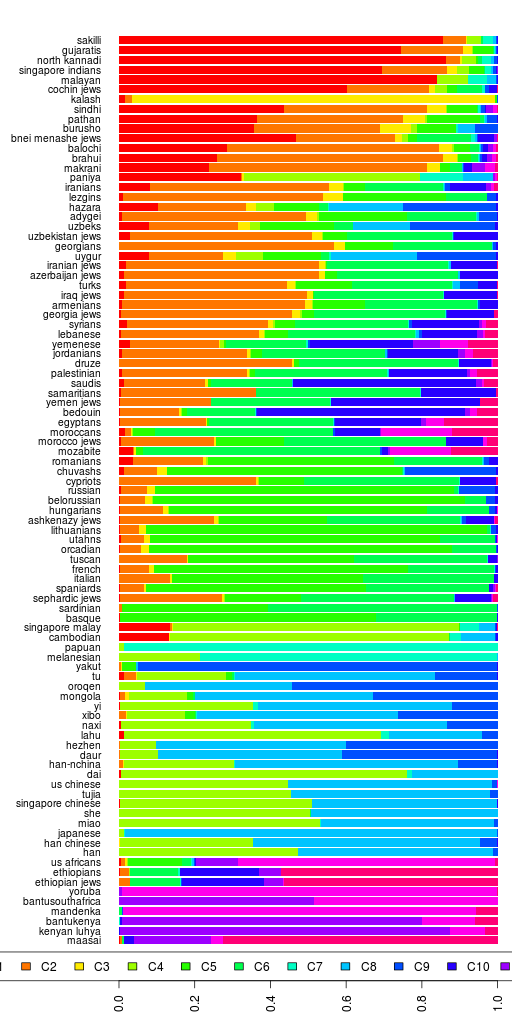
If you can't see the interactive chart above, here's a static image.
| C1 | South Asian | C2 | Balochistan/Caucasus |
|---|---|---|---|
| C3 | Kalash | C4 | Southeast Asian |
| C5 | European | C6 | Mediterranean |
| C7 | Papuan | C8 | Northeast Asian |
| C9 | Siberian | C10 | Southwest Asian |
| C11 | East African Bantus | C12 | West African |
| C13 | East African |
The new ancestral component at K=13 is C6. I am calling it Mediterranean because it's maximum among Mozabites (63%) and Sardinians (61%) but it is significant all over the Mediterranean.
Northern European groups lose some of their Pakistani/Caucasian component that they had in K=12 and gain in the K=13 European component. Now C5 can probably be called northern European. Most of the new Mediterranean component comes from the K=12 Southwest Asian.
Fst divergences between estimated populations for K=13:
| C1 | C2 | C3 | C4 | C5 | C6 | C7 | C8 | C9 | C10 | C11 | C12 |
|---|---|---|---|---|---|---|---|---|---|---|---|
| 0.056 | |||||||||||
| 0.066 | 0.062 | ||||||||||
| 0.089 | 0.124 | 0.136 | |||||||||
| 0.061 | 0.035 | 0.066 | 0.125 | ||||||||
| 0.081 | 0.062 | 0.090 | 0.147 | 0.047 | |||||||
| 0.167 | 0.204 | 0.219 | 0.202 | 0.205 | 0.226 | ||||||
| 0.080 | 0.117 | 0.128 | 0.032 | 0.117 | 0.140 | 0.190 | |||||
| 0.085 | 0.114 | 0.126 | 0.059 | 0.113 | 0.137 | 0.203 | 0.039 | ||||
| 0.082 | 0.057 | 0.094 | 0.146 | 0.057 | 0.057 | 0.225 | 0.139 | 0.138 | |||
| 0.145 | 0.152 | 0.177 | 0.192 | 0.158 | 0.163 | 0.258 | 0.187 | 0.191 | 0.152 | ||
| 0.154 | 0.162 | 0.186 | 0.201 | 0.168 | 0.173 | 0.266 | 0.195 | 0.199 | 0.162 | 0.014 | |
| 0.108 | 0.108 | 0.136 | 0.157 | 0.113 | 0.114 | 0.225 | 0.151 | 0.154 | 0.106 | 0.035 | 0.041 |
Dendrogram of the same:

PS. This was run using Admixture version 1.04 so I can make an apples-to-apples comparison with the previous runs.

1 Comments.