Continuing with Reference II admixture analysis, here is the results spreadsheet.
You can click on the legend to the right of the bar chart to sort by different ancestral components.
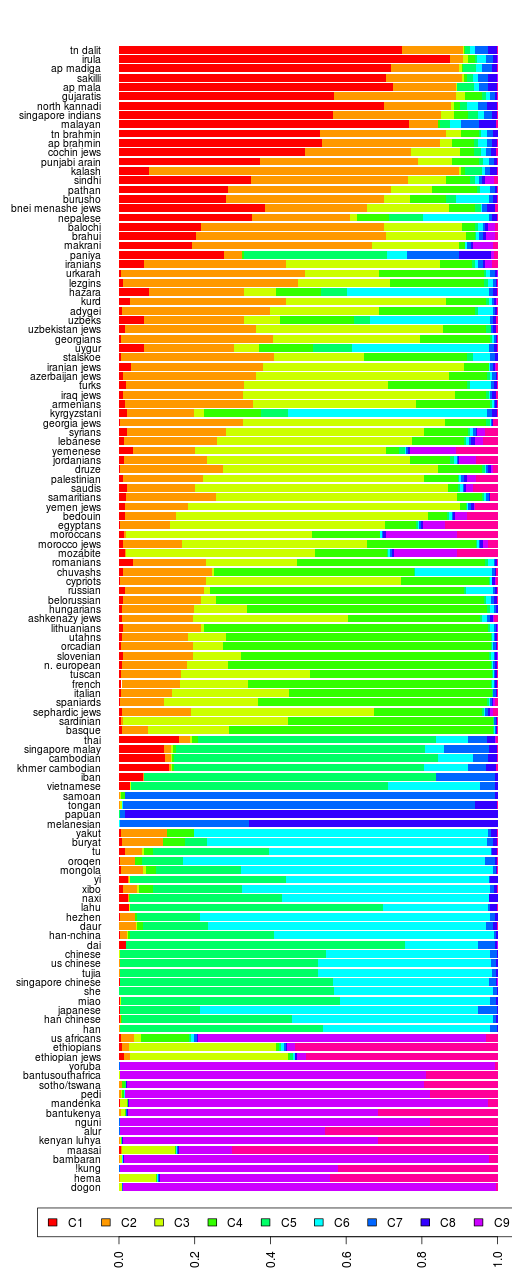
If you can't see the interactive chart above, here's a static image.
| C1 | South Asian | C2 | Kalash |
|---|---|---|---|
| C3 | Southwest Asian | C4 | European |
| C5 | Southeast Asian | C6 | Northeast Asian |
| C7 | Polynesian | C8 | Papuan |
| C9 | West African | C10 | East African |
Fst divergences dendrogram between estimated ancestral populations for K=10:

PS. This was run using Admixture version 1.04 so I can make an apples-to-apples comparison with the previous runs.

I cannot see your interactive bar chart this time, though I could see the ones you used previously. Did you use a different format?
All I added was some select queries for sorting. Though it was working for me (but was a bit slow), I have removed those. Let me know if it's working for you now.
It still does not show up. I loaded a previous blog entry to see that they old ones do show up.
I got a message saying "Error in query: Request timed out". Perhaps that is related?
Don't know why it's not working for you. It is for me.
Is anyone else having issues?
I am using the IE9 release candidate. It might just be an issue with a non-final build.
Not simply IE, but a release candidate! Wow.
gross. IE?
Neither the bar plot nor the dendrogram is working for me in lynx.
Very funny!
LOL
i'm good.