Tag Archives: ancestry - Page 4

Harappa and Reference I Dendrograms

Looking at the Harappa dendrogram and the dendrogram for reference I, I thought I would combine them to see where our project participants fit.

Then I got more curious. I wanted to see a similarity tree of all the samples in reference I (2,654) plus the 40 Harappa participants I have processed till now. That came out to be such a huge tree it was impossible to save it in a way to be legible. Finally I compromised by selecting only the South Asian samples from the Reference I dataset and putting them together with the Harappa data. Unfortunately, that doesn't give the Iranian and European-admixed participants any information. I'll have to analyze those separately.

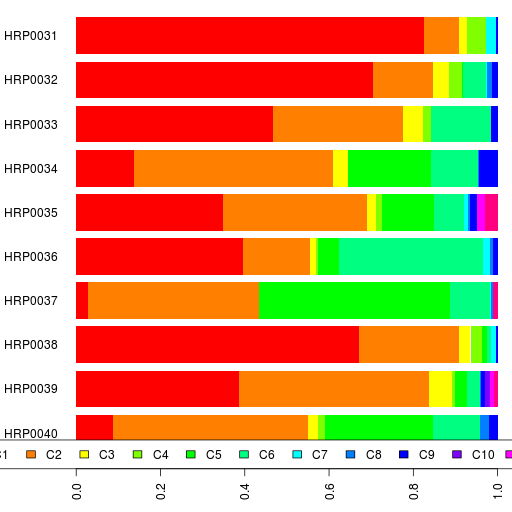
Anyway, here's the South Asian Admixture Dendrogram in PDF format. That means you can search for "HRP" to find all the project members, which is why I like PDF in this case better than an image.

Note that Singapore Indians are such a good stand-in for South Indians.

Harappa Admixture Dendrogram

Using the ancestral component percentages from the Admixture run at K=12 for Harappa Project participants, we can calculate the pairwise Euclidean distance between them. These distances can be used to create complete linkage (i.e. furthest neighbor) hierarchical clustering, which you see below.

Note that this is not a phylogeny. It just visualizes the closeness of your admixture results to others.

Thus in terms of admixture results, the Punjabis mostly cluster together along with the Rajasthani (HRP0033), except for my family (HRP0001 and HRP0035) who cluster (not so closely) with the Sindhi-Balochi guy (HRP0039) likely due to the Southwest Asian and African components.

Interestingly, the Bihari Brahmin (HRP0003) is very different from the Bihari Kayastha participant (HRP0032). The Caribbean Indian samples (HRP0027 & HRP0028) cluster with the Bihari Kayastha, so we can't really say for sure where from India their ancestors originated from.

The South Indian Brahmin samples seem to vary consistently from the non-Brahmin ones.

The Iranians cluster closely except for the Khorasanian HRP0034 and Assyrian HRP0010. The Assyrian Iranian sample is actually closer to the Iraqi/Egyptian Jewish sample (HRP0037) than to other Iranians.

The participants with recent European admixture cluster very loosely with each other. Other techniques will need to be used to pinpoint their specific South Asian origins.

If we make a cut at about 0.3 on this tree, we get 3 South Asian clusters:

  • the Northwest of South Asia
  • South Indian Brahmins, Bihari Brahmin, UP Brahmin
  • South Indian non-Brahmin, Bihari non-Brahmin, Bengalis, Caribbean Indians

I wish I had a thousand South Asian samples to play with. I wonder how this dendrogram would look in that case.

Admixture K=12, HRP0001 to HRP0040

Here are their ethnic backgrounds and the results spreadsheet. Also relevant are the reference I admixture results.

In case you guys are wondering, the new thing here are the results fro HRP0031 to HRP0040.

If you can't see the interactive charts above, Javascript might be disabled on your browser. Here's a static image for HRP0031 to HRP0040 admixture run.

PS. This was run using Admixture version 1.04.

Admixture K=9, HRP0001 to HRP0040

Here are their ethnic backgrounds and the results spreadsheet. Also relevant are the reference I admixture results.

In case you guys are wondering, the new thing here are the results fro HRP0031 to HRP0040.

PS. This was run using Admixture version 1.04.

Admixture K=4, HRP0001-HRP0040

Here are their ethnic backgrounds and the results spreadsheet. Also relevant are the reference I admixture results.

In case you guys are wondering, the new thing here are the results fro HRP0031 to HRP0040.

PS. This was run using Admixture version 1.04.

Improved Admixture Bar Charts

I have improved the Admixture bar charts further. As per your demands, ethnicity information is now available in a table right below the bar plot, in the same order as the bar plot IDs.

Also, you can click on any of the legend color rectangles on the right to sort the bar chart and the table by that ancestral component. Similarly, click on the header row of the table to sort by a column.

I might make some minor tweaks to this one.

Admixture K=12, HRP0021-HRP0030

Here are their ethnic backgrounds and the results spreadsheet. Also relevant are the reference I admixture results and this batch's results at lower K.

Batch 3 Admixture K=12

If you guys can confirm that the interactive bar chart is working well for you, then this is the last static bar plot.

PS. This was run using Admixture version 1.04.

Admixture K=12, HRP0011-HRP0020

Here are their ethnic backgrounds and the results spreadsheet. Also relevant are the reference I admixture results and this batch's results at lower K.

Batch 2 Admixture K=12

PS. This was run using Admixture version 1.04.

Admixture K=10-12, HRP0001 to HRP0010

Let's continue our admixture analysis of the first batch of Harappa participants.

Here are their ethnic backgrounds and their admixture analysis results.

You might want to refer to the admixture analysis of the reference dataset.

At K=10,

Batch 1 Admixture K=10

C1 South Asian C2 Kalash
C3 Southwest Asian C4 Southeast Asian
C5 European C6 Papuan
C7 Northeast Asian C8 Siberian
C9 West African C10 East African

At K=11,

Batch 1 Admixture K=11

C1 South Asian C2 Balochistan/Caucasus
C3 Kalash C4 Southeast Asian
C5 Southwest Asian C6 European
C7 Papuan C8 Northeast Asian
C9 Siberian C10 West African
C11 East African

Note the C2 component, it sounds a bit like ANI (Ancestral North Indian) of Reich et al, though hold off on your conclusions and your excitement for now.

Also, note that this split is different from the results of Reference I K=11 admixture run where the East African split happened. However, at K=12 we get similar components.

At K=12,

Batch 1 Admixture K=12

C1 South Asian C2 Balochistan/Caucasus
C3 Kalash C4 Southeast Asian
C5 Southwest Asian C6 European
C7 Papuan C8 Northeast Asian
C9 Siberian C10 East African Bantus
C11 West African C12 East African

I am going to explore even higher values of K since the crossvalidation errors are still decreasing.

Admixture K=4,7,9, HRP0021 to HRP0030

Here's the spreadsheet with their admixture results. And you can check their ethnic backgrounds.

You might also want to refer to the reference dataset I admixture analyses for K=2-5 and K=6-9.

I did not run admixture for all values of K this time. So let's start with K=4. For quick reference,

C1 South Asian
C2 European
C3 East Asian
C4 African

Batch 3 Admixture K=4

Now, for K=7, the ancestral components are:

C1 South Asian
C2 European
C3 Southeast Asian
C4 Southwest Asian
C5 Papuan
C6 Northeast Asian
C7 African

Batch 3 Admixture K=7

And finally, here's K=9.

C1 South Asian
C2 Kalash
C3 Southwest Asian
C4 Southeast Asian
C5 European
C6 Papuan
C7 Northeast Asian
C8 West African
C9 East African

Batch 3 Admixture K=9